
Optimization of Sand Casting Foundry Process for an Integral Ductile Iron Crossbeam
1. Introduction and Research Motivation
The growing demand for lightweight vehicles has accelerated the development of integrated forming technologies for structural components. In the field of commercial vehicle lightweighting, the mature experience of passenger car body weight reduction cannot be directly transferred. In particular, for core load‑bearing components such as crossbeams of commercial vehicles, lightweight alloys often fail to meet strength requirements, while traditional steel structures are constrained by complex multi‑process manufacturing routes. Ductile iron, with its unique capability of integral forming, combined with excellent mechanical properties and process adaptability, has become an innovative solution for the lightweight transformation of commercial vehicles. My research focuses on the lightweight design of a commercial vehicle crossbeam through an integrated structural solution. Under the premise of ensuring structural load‑bearing performance, the traditional welded steel structure is replaced by an integral ductile iron casting. To minimize casting defects and improve product quality, I employed numerical simulation technology to systematically analyze the filling and solidification processes, and optimized the casting process parameters. This engineering‑scale study aims to provide a comprehensive solution from product design, process verification, to quality control, and to advance the application of sand casting foundry technology in high‑strength ductile iron structural parts.
2. Material Preparation and Characterization Methods
2.1 Raw Materials and Melting Process
The experimental material used in this work was QT800‑5 ductile iron. The raw materials consisted of high‑purity Q10 pig iron (low sulfur, low manganese), carbon steel scrap, foundry returns, ferrosilicon, nodulizer, inoculants, and alloying elements such as electrolytic copper, nickel, and ferromolybdenum. The nominal chemical composition of the raw materials is summarized in Table 1. The nodulizer was FeSiMg6RE2 rare‑earth magnesium alloy, and the nodularizing treatment was performed by the cored‑wire feeding method. A Si‑Ba inoculant was used for ladle inoculation, and 75SiFe was used for stream inoculation.
Table 1. Chemical composition of raw materials (wt.%)
| Material | C | Si | Mn | P | S | RE | Mg | Ba | Fe |
|---|---|---|---|---|---|---|---|---|---|
| High‑purity pig iron | 4.25 | 0.23 | 0.05 | 0.018 | 0.010 | – | – | – | Bal. |
| Steel scrap | 0.26 | 0.22 | 0.20 | 0.02 | 0.01 | – | – | – | Bal. |
| Nodulizer | – | 41–44 | 2–3 | – | – | 6–7 | 6–7 | – | Bal. |
| Si‑Ba inoculant | – | 60–65 | – | – | – | – | – | 4–6 | Bal. |
| 75SiFe | – | 72–80 | – | – | – | – | – | – | Bal. |
The melting was carried out in a 1000‑kg medium‑frequency induction furnace. The charge was composed of pig iron, steel scrap, returns, and alloying additions. After complete melting, slag was removed and the melt was superheated to 1530–1570 °C. Nodularizing was performed at 1490–1520 °C using the cored‑wire method. The addition of FeSiMg6RE2 was 1.35–1.45 wt.% of the melt. Inoculation was performed in three stages: primary ladle inoculation with 0.3–0.4 wt.% Si‑Ba inoculant, secondary inoculation during melt transfer with 0.2–0.3 wt.%, and final stream inoculation during pouring with 0.1–0.2 wt.%. The pouring temperature was controlled in the range of 1380–1420 °C. All melts were poured within 10 minutes after nodularizing to avoid fade of nodulizing and inoculation effects. The actual pouring process is shown in Figure 1. Y‑block test samples were cast for material characterization, with dimensions as depicted in Figure 2. The optimized sand casting foundry route was applied throughout.
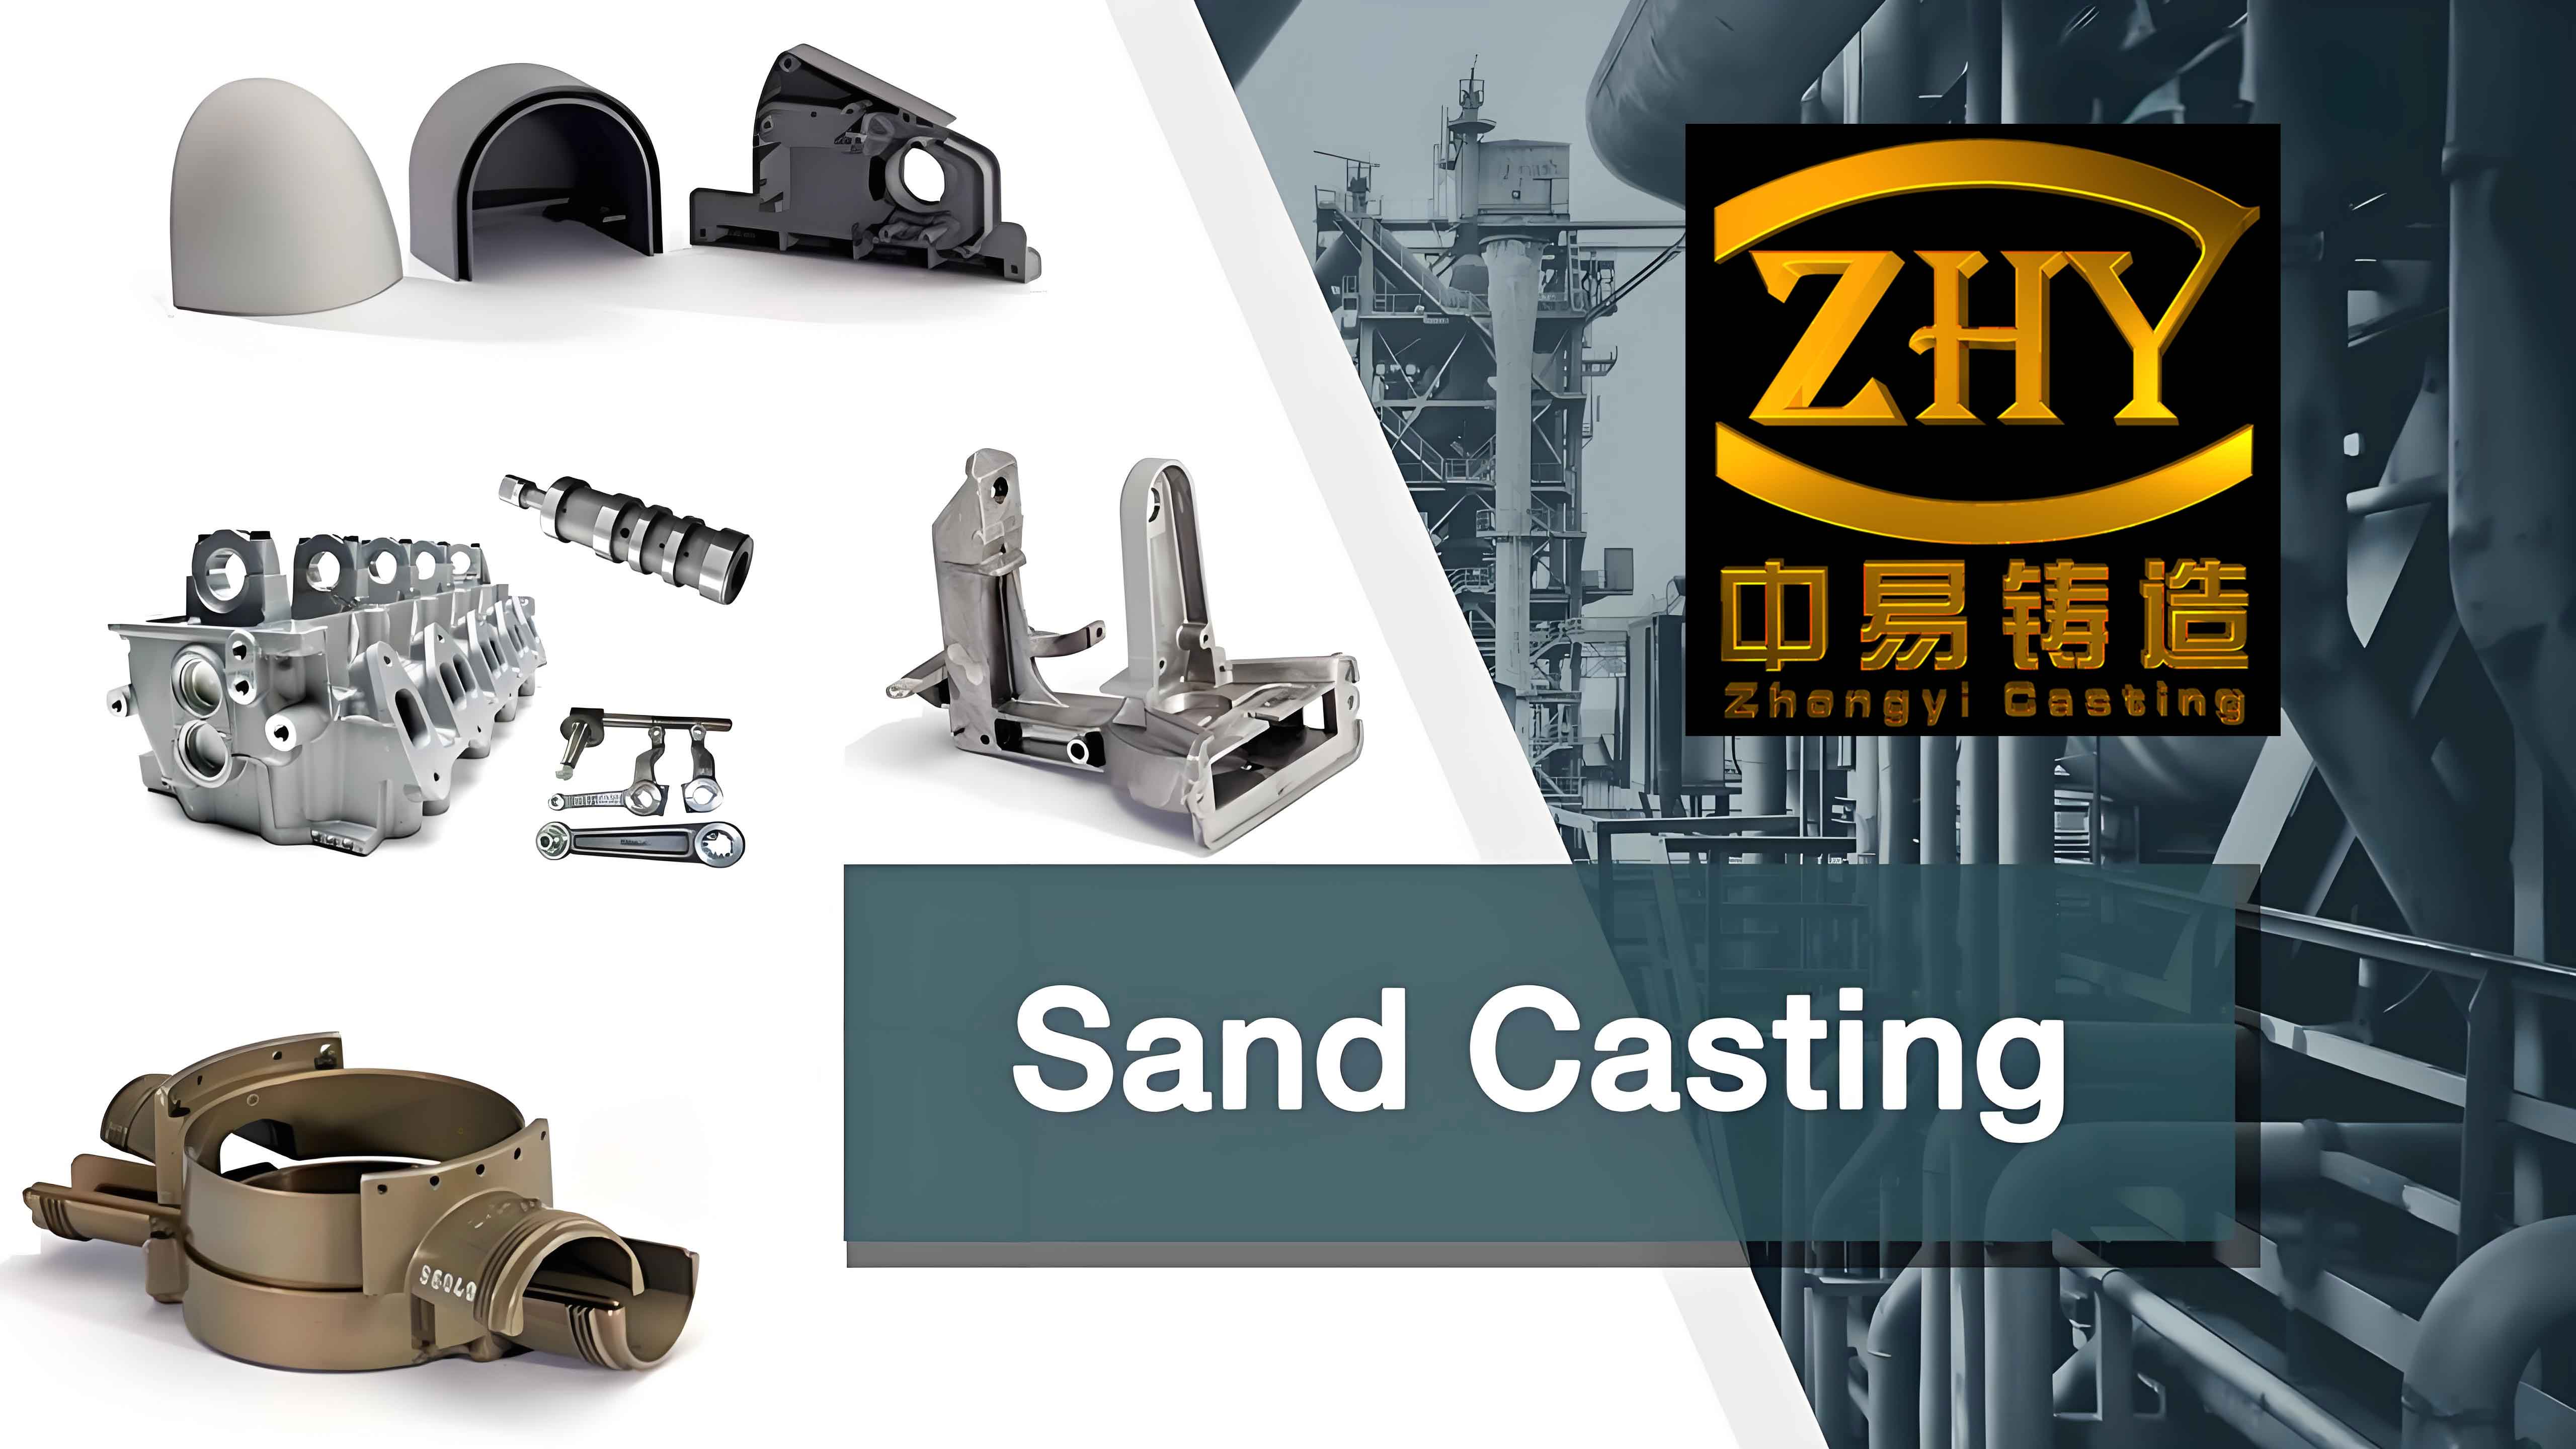
Typical sand cast ductile iron parts produced in a modern sand casting foundry are shown above. The image illustrates the complex geometries and high surface quality that can be achieved in ductile iron castings.
2.2 Characterization Procedures
Chemical composition was analyzed by inductively coupled plasma atomic emission spectrometry (ICP‑AES) on white‑iron chilled samples. The final reported value is the average of three measurements. Metallographic specimens were cut from different locations of the crossbeam casting, ground with SiC papers from 400 to 2000 grit, polished with alumina suspension, and etched with 4% nital solution. Microstructural observation was performed using a Zeiss Axiolab5 optical microscope. Graphite nodularity and size were rated according to GB/T 9441‑2021. Tensile tests were carried out on a SHIMADZU AGS‑X universal testing machine at a constant crosshead speed of 0.75 mm/min. The geometry of the tensile specimens is shown in Figure 3 (50 mm gauge length, 10 mm diameter). Hardness was measured with a Vickers hardness tester using a load of 3000 N for 15 s. Fracture surfaces were examined by field‑emission scanning electron microscopy (SEM) equipped with energy‑dispersive X‑ray spectroscopy (EDS).
Table 2. Evaluation criteria for graphite nodularity
| Nodularity grade | 1 | 2 | 3 | 4 | 5 | 6 |
|---|---|---|---|---|---|---|
| Nodularity (%) | ≥95 | 90 | 80 | 70 | 60 | 50 |
Table 3. Graphite size classification (at 100×)
| Graphite size grade | 3 | 4 | 5 | 6 | 7 | 8 |
|---|---|---|---|---|---|---|
| Graphite diameter (µm) | 25–50 | 12–25 | 6–12 | 3–6 | 1.5–3 | ≤1.5 |
3. Structural Integrated Design of the Crossbeam
3.1 Static Analysis Fundamentals
Static analysis was employed to evaluate the displacement, stress, strain, and forces in the crossbeam under fixed loads. The analysis assumes equilibrium, rigid‑body behavior to a first approximation, linear elasticity, and time‑independence of loads. For a linear elastic isotropic material, the stress‑strain relationship is given by Hooke’s law:
$$ \boldsymbol{\sigma} = \mathbf{C} : \boldsymbol{\varepsilon}, $$
where \(\boldsymbol{\sigma}\) is the Cauchy stress tensor, \(\mathbf{C}\) is the fourth‑order stiffness tensor, and \(\boldsymbol{\varepsilon}\) is the infinitesimal strain tensor.
3.2 Original Crossbeam Structure and Static Analysis
The original crossbeam had a mass of 50.5 kg and consisted of seven parts: four L‑shaped steel plates, two fixing seats, and one U‑shaped steel plate. The technical parameters are listed in Table 4. The three‑dimensional model is shown in Figure 1 (not reproduced here). The original crossbeam required separate processing and assembly of all parts, which was time‑consuming and costly. To establish a baseline, I performed static analysis of the original structure under four typical loading conditions: acceleration, turning, torsion, and emergency braking. The loads and constraints were applied as shown in Figure 2 (conceptual representation). The maximum equivalent stresses are presented in Table 5.
Table 4. Main technical parameters of the original crossbeam
| Component | Material | Elastic modulus (MPa) | Yield strength (MPa) | Poisson’s ratio | Mass (kg) |
|---|---|---|---|---|---|
| Fixing seat | QT550 | 172000 | 320 | 0.275 | 9.78×2 |
| Steel plate | B510L | 200000 | 355 | 0.3 | (4.46+5.07)×2 |
Table 5. Maximum equivalent stresses in the original crossbeam under different conditions
| Condition | Maximum stress (MPa) | Location |
|---|---|---|
| Acceleration | 85.1 | Bolt hole |
| Turning | 396.1 | Bolt hole |
| Torsion | 680.6 | Bolt hole |
| Emergency braking | 95.4 | Bolt hole |
The original crossbeam exceeded the yield strength of the material under torsion (680.6 MPa > 355 MPa for B510L), indicating a risk of plastic deformation. Hence, an integrated structural redesign was necessary.
3.3 Design Criteria and Key Factors
The integrated design of the crossbeam followed several principles: (a) minimum wall thickness to ensure adequate filling while avoiding hot spots; (b) flexible stiffening ribs to reduce stress concentration and improve energy absorption; (c) good force‑transmission state via smooth transitions and rounded corners; (d) appropriate material selection considering castability and mechanical properties; (e) manufacturing‑oriented design, including proper draft angles and parting line selection; (f) cost-effectiveness and safety. The key design factors included material selection, geometric shape, manufacturing process, load environment, and economic/safety considerations.
3.4 Integral Crossbeam Design
To replace the seven‑piece welded steel assembly, I designed an integral ductile iron crossbeam. The material was changed from steel to QT800‑5 ductile iron. To maintain equal stiffness, the wall thickness of the ductile iron beam was calculated using the equivalent stiffness formula for bending plates:
$$ E_s t_s^3 = E_d t_d^3, $$
where \(E_d\) and \(E_s\) are the elastic moduli of ductile iron and steel, respectively, and \(t_d\) and \(t_s\) are the corresponding thicknesses. With \(E_d = 172000\) MPa and \(E_s = 200000\) MPa, the minimum thickness of ductile iron was found to be 8.0 mm. The crossbeam body was redesigned from an I‑section to a circular‑section torsion‑resistant structure, and stiffening ribs were added to enhance structural rigidity. The final integral crossbeam model had overall dimensions of 839 mm × 403 mm × 221 mm and a mass of 36 kg, corresponding to a 28.7% weight reduction compared to the original 50.5 kg.
3.5 Static Analysis of the Integral Crossbeam
Finite element analysis was performed with the crossbeam placed in the full frame environment. The frame rails and steel plate components were meshed with elastic shell elements (4‑node quadrilateral), while the ductile iron crossbeam was meshed with first‑order tetrahedral elements. The total number of elements and nodes for the integrated model were 3,309,713 and 133,147, respectively. Connections were simulated using rigid elements (RBE2). The load cases were the same as those used for the original structure. The maximum equivalent stresses are summarized in Table 6. The highest stress, 558.4 MPa, occurred at the threaded holes under the torsion condition, which is lower than the yield strength of QT800‑5 (approximately 800 MPa), yielding a safety factor of 1.4. Thus, the integrated design satisfied the strength requirements for commercial vehicles.
Table 6. Maximum equivalent stresses in the integrated crossbeam
| Condition | Maximum stress (MPa) | Location |
|---|---|---|
| Acceleration | 69.3 | Bolt hole |
| Turning | 311.1 | Bolt hole |
| Torsion | 558.4 | Bolt hole |
| Emergency braking | 95.4 | Bolt hole |
4. Casting Process Design
4.1 Parting Line Selection
In sand casting foundry practice, the parting line must be carefully chosen to facilitate pattern withdrawal, ensure dimensional accuracy, and minimize the projected area on the parting plane. The selected parting line follows the maximum outer contour of the crossbeam, as indicated in Figure 4 (schematic representation). This solution allows a flat and simple parting surface, which is preferred for a horizontally‑parted molding line.
4.2 Process Parameter Determination
Several key process parameters were initially established based on experience and empirical formulas.
Pouring time: The pouring time was estimated by:
$$ t = f \sqrt[3]{G + \sqrt{0.2 W G}} $$
where \(f\) is a material coefficient (0.6–0.8), \(G\) is the casting mass (kg), and \(W\) is the average wall thickness (mm). The calculation gave a pouring time of approximately 7.27 s, corresponding to an average pouring rate of 11 cm/s.
Pouring temperature: Considering the complex geometry with wall thicknesses ranging from 8.0 mm to 55.4 mm, an initial pouring temperature range of 1380–1420 °C was selected to ensure complete filling while avoiding degradation of nodulizing/inoculating effects.
Mold temperature: The sand mold temperature was set to 20 °C (room temperature) as the baseline.
Casting shrinkage: For pearlitic ductile iron, the shrinkage rate was taken as 1.2% for constrained contraction.
4.3 Core Design
The internal cavities of the crossbeam required a sand core. A single integral core was designed using self‑setting resin‑bonded sand. Venting channels were incorporated into the core to allow efficient escape of gases generated by the decomposition of the resin binder, thereby preventing gas porosity in the casting. The core design is depicted in Figure 5 (schematic). The core dimensions were determined from the internal geometry of the casting.
4.4 Gating System Design
Because of the large span and complex shape of the crossbeam, a closed gating system was adopted. The cross‑sectional area ratio was chosen as
$$ F_{\text{sprue}} : F_{\text{runner}} : F_{\text{ingate}} = 2.50 : 1.25 : 1.0. $$
The total ingate area was calculated using the flow equation:
$$ A_g = \frac{V}{v_g t}, $$
where \(A_g\) is the ingate area (mm²), \(V\) is the volume of metal passing through the ingates, \(v_g\) is the linear velocity of the metal, and \(t\) is the filling time. The calculated ingate area was 1200 mm², with runner area 1500 mm² and sprue area 3000 mm². Four ingates were symmetrically distributed to achieve uniform filling and to promote directional solidification. The initial gating system layout for a two‑cavity mold is shown in Figure 6. To reduce computational cost, subsequent simulations were performed on a single casting with a corresponding gating system.
5. Numerical Simulation: Finite Element Model and Initial Analysis
5.1 Model Setup
All simulations were carried out using a commercial casting simulation software based on finite element / finite difference methods. The casting geometry was imported in STL format. A uniform mesh size of 2 mm was selected after a mesh sensitivity analysis, resulting in total mesh count of approximately 12,266,795 elements. The physical properties of QT800‑5 are listed in Table 7. The density and thermal conductivity curves were provided by the software database. The heat transfer coefficient between the metal and the sand mold was set to 700 W/m²·K, and gravity was applied in the negative Z direction with a magnitude of 980 cm/s².
Table 7. Physical properties of QT800‑5 used in simulation
| Property | Value |
|---|---|
| Density (kg/m³) | 6459 |
| Liquidus temperature (K) | 1457 |
| Solidus temperature (K) | 1418 |
| Latent heat (kJ/kg) | 210 |
| Specific heat (kJ/(kg·K)) | 0.78 |
5.2 Initial Casting Simulation and Design Optimization
Initial simulations were performed with a pouring temperature of 1400 °C, pouring speed of 11 cm/s, and mold temperature of 20 °C. The filling process was judged to be stable, but the solidification analysis revealed the formation of isolated liquid pools at the two thick‑wall ends of the crossbeam, which would lead to shrinkage cavities and porosity. The predicted shrinkage defect volume was 751.16 mm³. To improve feeding, I increased the number of risers from 4 to 8 (each Ø70 mm × 120 mm) and placed them at both ends of the crossbeam. The optimized gating system is shown in Figure 7 (conceptual layout). After optimization, the filling pattern remained smooth, the isolated pools disappeared, and the shrinkage defect volume decreased to 685.85 mm³, an 8.69% reduction. The solidification time was reduced from 436 s to 307.67 s for the end regions. Most remaining defects were transferred into the risers, which is favorable for the soundness of the casting.
Table 8. Comparison of initial and optimized gating system
| Scheme | Number of risers | Riser dimensions | Shrinkage defect volume (mm³) | Defect location |
|---|---|---|---|---|
| Initial | 4 | – | 751.16 | Both ends (isolated pools) |
| Optimized | 8 | 4×Ø70×120 mm at each end | 685.85 | Mostly in risers |
6. Influence of Pouring Temperature and Pouring Speed
6.1 Effect of Pouring Temperature
Using the optimized gating system, I investigated three pouring temperatures (1380 °C, 1400 °C, 1420 °C) at a constant pouring speed of 11 cm/s. The filling process was stable for all temperatures. The temperature field at 1380 °C showed lower overall temperatures but no cold shuts or misruns. At 1420 °C, the filling was slightly faster and more turbulent, potentially increasing air entrainment. The maximum gas entrapment values were extracted: 1700.58 mm³, 1682.44 mm³, and 1697.82 mm³ for 1380, 1400, and 1420 °C, respectively. Thus, 1400 °C produced the lowest gas entrapment. The solidification time increased with pouring temperature: 307.67 s at 1380 °C, 326.96 s at 1400 °C, and 346.33 s at 1420 °C. Shrinkage porosity volumes were 667.92, 685.85, and 702.11 mm³, respectively, showing a monotonically increasing trend with temperature. Therefore, lower pouring temperature reduces shrinkage porosity but slightly increases gas entrapment when the temperature is 1380 °C compared with 1400 °C.
Table 9. Simulation results at different pouring temperatures (v = 11 cm/s)
| Pouring temperature (°C) | Gas entrainment (mm³) | Shrinkage porosity (mm³) | Solidification time (s) |
|---|---|---|---|
| 1380 | 1700.58 | 667.92 | 307.67 |
| 1400 | 1682.44 | 685.85 | 326.96 |
| 1420 | 1697.82 | 702.11 | 346.33 |
6.2 Effect of Pouring Speed
In a similar manner, I evaluated three pouring speeds (10, 11, 12 cm/s) at a constant pouring temperature of 1400 °C. A lower speed (10 cm/s) produced the smoothest filling and the lowest gas entrainment (1655.77 mm³), while the highest speed (12 cm/s) produced faster filling and a more uniform temperature field, but higher gas entrainment (1700.39 mm³). Shrinkage porosity decreased with increasing speed: 696.92 mm³ at 10 cm/s, 685.85 mm³ at 11 cm/s, and 680.85 mm³ at 12 cm/s. This is because a faster fill reduces heat loss and provides better feeding. However, excessive velocity increases the risk of air entrapment. The solidification time varied from 305.69 s (10 cm/s) to 348.38 s (12 cm/s).
Table 10. Simulation results at different pouring speeds (T = 1400 °C)
| Pouring speed (cm/s) | Gas entrainment (mm³) | Shrinkage porosity (mm³) | Solidification time (s) |
|---|---|---|---|
| 10 | 1655.77 | 696.92 | 305.69 |
| 11 | 1682.44 | 685.85 | 326.96 |
| 12 | 1700.39 | 680.85 | 348.38 |
7. Orthogonal Experimental Design and Statistical Analysis
7.1 Design of Experiments
To identify the optimal combination of pouring speed (A) and pouring temperature (B) in a systematic manner, I employed a two‑factor, three‑level orthogonal experiment. The factors and levels are listed in Table 11. The experimental plan (L9 orthogonal array) and the corresponding simulation results for the gas entrainment (Ygas) and shrinkage porosity volume (Yshrink) are given in Table 12.
Table 11. Factors and levels for the orthogonal experiment
| Level | A: Pouring speed (cm/s) | B: Pouring temperature (°C) |
|---|---|---|
| 1 | 10 | 1380 |
| 2 | 11 | 1400 |
| 3 | 12 | 1420 |
Table 12. Orthogonal experimental design and simulation results
| Run | A (cm/s) | B (°C) | Ygas (mm³) | Yshrink (mm³) |
|---|---|---|---|---|
| 1 | 10 | 1380 | 1677.19 | 679.18 |
| 2 | 10 | 1400 | 1655.77 | 696.92 |
| 3 | 10 | 1420 | 1668.84 | 713.20 |
| 4 | 11 | 1400 | 1682.44 | 685.85 |
| 5 | 11 | 1420 | 1697.82 | 702.11 |
| 6 | 11 | 1380 | 1700.58 | 667.92 |
| 7 | 12 | 1420 | 1704.32 | 697.20 |
| 8 | 12 | 1400 | 1700.39 | 680.85 |
| 9 | 12 | 1380 | 1721.51 | 663.00 |
7.2 Range (Extreme Difference) Analysis
For the gas entrainment indicator, the average values for each factor level were computed as follows:
For factor A (pouring speed):
$$\bar{K}_{A1}^{gas} = \frac{1677.19 + 1655.77 + 1668.84}{3} = 1667.27,$$
$$\bar{K}_{A2}^{gas} = \frac{1682.44 + 1697.82 + 1700.58}{3} = 1693.61,$$
$$\bar{K}_{A3}^{gas} = \frac{1704.32 + 1700.39 + 1721.51}{3} = 1708.74.$$
The range \(R_A^{gas} = 1708.74 – 1667.27 = 41.47\). Similarly, for factor B (pouring temperature), the averages are:
$$\bar{K}_{B1}^{gas} = \frac{1677.19 + 1700.58 + 1721.51}{3} = 1699.76,$$
$$\bar{K}_{B2}^{gas} = \frac{1655.77 + 1682.44 + 1700.39}{3} = 1679.53,$$
$$\bar{K}_{B3}^{gas} = \frac{1668.84 + 1697.82 + 1704.32}{3} = 1690.33.$$
The range \(R_B^{gas} = 1699.76 – 1679.53 = 20.23\). Since \(R_A^{gas} > R_B^{gas}\), pouring speed has a greater effect on gas entrainment than pouring temperature in this orthogonal set.
For the shrinkage porosity indicator, the average values are:
For factor A:
$$\bar{K}_{A1}^{sh} = \frac{679.18 + 696.92 + 713.20}{3} = 696.43,$$
$$\bar{K}_{A2}^{sh} = \frac{685.85 + 702.11 + 667.92}{3} = 685.29,$$
$$\bar{K}_{A3}^{sh} = \frac{697.20 + 680.85 + 663.00}{3} = 680.35.$$
Range \(R_A^{sh} = 696.43 – 680.35 = 16.08\). For factor B:
$$\bar{K}_{B1}^{sh} = \frac{679.18 + 667.92 + 663.00}{3} = 670.03,$$
$$\bar{K}_{B2}^{sh} = \frac{696.92 + 685.85 + 680.85}{3} = 687.87,$$
$$\bar{K}_{B3}^{sh} = \frac{713.20 + 702.11 + 697.20}{3} = 704.17.$$
Range \(R_B^{sh} = 704.17 – 670.03 = 34.14\). Since \(R_B^{sh} > R_A^{sh}\), pouring temperature dominates the shrinkage porosity behavior.
7.3 Analysis of Variance (ANOVA)
To quantitatively evaluate the significance of each factor, I performed ANOVA. For the gas entrainment data, the sum of squares for factor A, factor B, and error were calculated. The results are shown in Table 13. The F‑statistic for factor A was 24.266 with \(p = 0.006 < 0.05\), indicating a statistically significant effect of pouring speed on gas entrainment. Factor B was not significant (\(F = 5.211, p = 0.077\)). For the shrinkage porosity data (Table 14), factor B was significant (\(F = 12.247, p = 0.017 < 0.05\)), while factor A was not significant (\(F = 2.847, p = 0.167\)). These results confirm that pouring speed primarily controls gas entrapment, while pouring temperature primarily controls shrinkage porosity in the investigated range.
Table 13. ANOVA for gas entrainment
| Source | Sum of squares | df | Mean square | F | p |
|---|---|---|---|---|---|
| A (speed) | 2643.000 | 2 | 1321.500 | 24.266 | 0.006 |
| B (temperature) | 567.608 | 2 | 283.804 | 5.211 | 0.077 |
| Error | 108.919 | 2 | 54.459 | – | – |
Table 14. ANOVA for shrinkage porosity volume
| Source | Sum of squares | df | Mean square | F | p |
|---|---|---|---|---|---|
| A (speed) | 406.121 | 2 | 203.061 | 2.847 | 0.167 |
| B (temperature) | 1747.142 | 2 | 873.571 | 12.247 | 0.017 |
| Error | 142.659 | 2 | 71.330 | – | – |
7.4 Selection of Optimal Parameters
Based on the range analysis and ANOVA, the optimal conditions for minimizing both gas entrainment and shrinkage porosity were determined. For gas entrainment, the preferred levels were A1 (10 cm/s) and B2 (1400 °C). For shrinkage porosity, the preferred levels were A3 (12 cm/s) and B1 (1380 °C). Since gas entrainment is more affected by pouring speed, a lower speed is favored; however, a speed that is too low may cause pouring defects due to premature freezing. A speed of 11 cm/s provides a balanced compromise. For temperature, 1380 °C minimizes shrinkage porosity but slightly increases gas entrainment; 1400 °C gave the lowest gas entrapment. Considering all factors and the significance tests, the final chosen optimal combination was: pouring speed = 11 cm/s, pouring temperature = 1380 °C, and mold temperature = 20 °C. This combination corresponds to run 6 in the orthogonal array, which had the lowest shrinkage porosity (667.92 mm³) and an acceptable gas entrainment (1700.58 mm³).
8. Production Trial with the Optimized Process
8.1 Casting Experiment
Based on the numerical simulation and statistical optimization, production trials of the integral ductile iron crossbeam were carried out in a commercial sand casting foundry. The optimized gating system with eight risers was used. The melting, nodularizing, and inoculation procedures were identical to those described in Section 2. The pouring temperature was controlled at 1380 °C and the pouring speed was approximately 11 cm/s. After casting, the molds were cooled below 400 °C before shakeout. The castings were then fettled, and the gating system was removed. Casting samples were cut from three positions: Position 1 (near the gate, thick‑walled end), Position 2 (thin‑walled middle shaft), and Position 3 (far from the gate, complex end). The sampling positions are illustrated in Figure 8 (schematic).
8.2 Chemical Composition
The chemical composition of the trial casting is given in Table 15. The carbon equivalent was in the typical range for ductile iron, with low phosphorus and sulfur contents, ensuring the formation of spheroidal graphite without phosphide eutectics. The residual magnesium content (0.043%) was sufficient to guarantee nodularity.
Table 15. Chemical composition of the integral crossbeam casting (wt.%)
| C | Si | Mn | P | S | Mg | Ni | Mo | Cu |
|---|---|---|---|---|---|---|---|---|
| 3.61 | 2.67 | 0.105 | 0.007 | 0.007 | 0.043 | 0.438 | 0.151 | 0.803 |
8.3 Microstructural Characterization
Figure 9 shows the graphite morphology and matrix structure of the samples taken from the three positions. The graphite nodularity was rated as grade 2 (nodularity ≥90%) at all positions, and the graphite size corresponded to grades 6–7. The matrix consisted of pearlite, ferrite, and graphite nodules. The pearlite content was greater than 90% at all locations, with only about 1% carbides. The nodule count varied with cooling rate: 180 nodules/mm² at Position 1 (near the gate, slow cooling), 252 nodules/mm² at Position 2 (thin wall, fast cooling), and 212 nodules/mm² at Position 3 (remote thick section). The metallographic rating results are summarized in Table 16. X‑ray inspection of the casting indicated no shrinkage porosity, cracks, or gas holes in the critical zones of the middle and ends.
Table 16. Metallographic ratings of the three sampling positions
| Position | Nodularity grade | Graphite size grade | Pearlite content (%) | Carbide (%) | Phosphide eutectic |
|---|---|---|---|---|---|
| 1 (near gate) | 2 | 6 | ≥90 | 1 | None |
| 2 (thin shaft) | 2 | 7 | ≥95 | 1 | None |
| 3 (far gate) | 2 | 6 | ≥90 | 1 | None |
8.4 Mechanical Properties
Tensile tests were performed on samples taken from the three positions. The results are presented in Table 17. All positions met the QT800‑5 specifications (yield strength ≥500 MPa, tensile strength ≥800 MPa, elongation ≥5%). The thin‑walled position 2 exhibited the highest tensile strength (891 MPa) and yield strength (562 MPa), but the lowest elongation (6.0%). The near‑gate position 1 had the best elongation (7.6%) with a tensile strength of 875 MPa. The remote position 3 showed the lowest strength (854 MPa) and good elongation (6.5%). These variations are consistent with the local cooling rates and microstructural differences. Hardness measurements (Table 18) indicated values in the range of 272–297 HV across all positions, with low scatter.
Table 17. Tensile properties of the integral crossbeam at different positions
| Position | Yield strength (MPa) | Tensile strength (MPa) | Elongation (%) |
|---|---|---|---|
| 1 | 546 | 875 | 7.6 |
| 2 | 562 | 891 | 6.0 |
| 3 | 552 | 854 | 6.5 |
Table 18. Vickers hardness measurements (HV)
| Position | Indentation 1 | Indentation 2 | Indentation 3 | Average |
|---|---|---|---|---|
| 1 | 280.8 | 285.8 | 285.8 | 284.1 |
| 2 | 272.2 | 293.8 | 279.7 | 281.9 |
| 3 | 297.3 | 280.8 | 279.7 | 285.9 |
8.5 Fracture Surface and EDS Analysis
The fracture surfaces of the tensile specimens were examined by SEM. The overall fracture morphology exhibited cleavage facets and river patterns, characteristic of brittle fracture in high‑strength ductile iron. In some regions, oxide inclusions were observed. A typical inclusion was identified by EDS as mainly CaO, as shown in Figure 10 (chemical analysis). The presence of such angular oxides intensifies stress concentration and acts as crack initiators, effectively reducing the tensile strength. The graphite nodules themselves also served as crack sources, but they are less harmful than sharp oxide inclusions. The fracture surface of the near‑gate sample showed smaller cleavage facets and more plastic deformation, consistent with its higher elongation.
9. Discussion
The optimization of the sand casting foundry process for the integral ductile iron crossbeam was successfully accomplished by combining structural design, numerical simulation, and statistical experimental design. The crucial issue was the delicate balance between gas entrapment (which is strongly affected by pouring speed) and shrinkage porosity (strongly affected by pouring temperature). The orthogonal experiment and ANOVA provided a rational basis for selecting the compromise parameters. The final chosen parameters (11 cm/s pouring speed and 1380 °C pouring temperature) yielded a casting with excellent mechanical properties and acceptable defect levels. The production trial confirmed the numerical predictions: the obtained microstructure showed uniformly distributed spheroidal graphite and a high fraction of pearlite, giving tensile strengths in excess of 850 MPa.
The success of the optimized sand casting foundry procedure depended on several key factors:
- Proper riser placement and sizing to promote directional solidification and compensate for solidification shrinkage while exploiting the graphitization expansion.
- Controlled pouring parameters that minimize both gas entrapment and temperature loss.
- Robust gating design with a closed system and four ingates to ensure laminar filling of the complex cavity.
- High‑quality nodularization and inoculation practice to guarantee high nodule count and absence of carbides.
The results demonstrated that the integral ductile iron crossbeam produced by the optimized sand casting foundry process meets all engineering requirements, achieving a 28.7% weight reduction while satisfying the strength and safety criteria. The integrated design‑simulation‑experiment approach proved to be an efficient methodology for developing high‑performance ductile iron castings in a modern sand casting foundry environment.
10. Conclusions
In this work, I designed an integral commercial vehicle crossbeam made of ductile iron and optimized its sand casting foundry process using numerical simulation, orthogonal experiments, and production trials. The main conclusions are as follows:
- The integral design of the crossbeam, replacing a seven‑piece welded steel assembly, reduced the mass from 50.5 kg to 36 kg, a 28.7% reduction. Static analysis under four load cases showed a maximum equivalent stress of 558.4 MPa under torsion, providing a safety factor of 1.4 for QT800‑5 material.
- The initial gating system was optimized by increasing the number of risers from 4 to 8, which reduced shrinkage porosity from 751.16 mm³ to 685.85 mm³ (8.69% reduction) and eliminated the isolated liquid pools at the ends.
- Systematic simulations showed that pouring speed mainly affects gas entrainment, while pouring temperature mainly affects shrinkage porosity. ANOVA confirmed the statistical significance of these relationships.
- The optimal process parameters were determined as: pouring speed = 11 cm/s, pouring temperature = 1380 °C, and mold temperature = 20 °C. The predicted shrinkage porosity for this combination was 667.92 mm³, the lowest among all tested combinations.
- The production trial validated the optimized process. The casting had a stable chemical composition, high nodularity (grade 2), pearlite content ≥90%, and uniform graphite distribution. Mechanical tests confirmed tensile strength ≥854 MPa, yield strength ≥546 MPa, elongation ≥6.0%, and hardness ≥270 HV, meeting the QT800‑5 requirements.
- Fracture analysis revealed the presence of CaO oxide inclusions, which are more detrimental to mechanical properties than graphite nodules. Careful melt treatment and pouring in the sand casting foundry are necessary to minimize such inclusions.
The integrated methodology developed in this study provides a strong basis for the production of high‑quality ductile iron structural components in a sand casting foundry and contributes to the lightweighting of commercial vehicles.