
I study a ductile iron casting process for a bearing seat because the component must combine dimensional stability, load-bearing capacity, and resistance to internal shrinkage defects. The bearing seat is a critical transmission and support component. It reduces friction between a rotating shaft and its supporting structure, protects the support from excessive stress, and helps maintain efficient and stable operation of mechanical equipment. In my work, the main quality index is the defect volume fraction, which I denote as \(Y_1\). I use numerical simulation of mold filling and solidification, supported by orthogonal tests, to identify how pouring temperature, mold temperature, and pouring speed affect defect formation in the ductile iron casting.
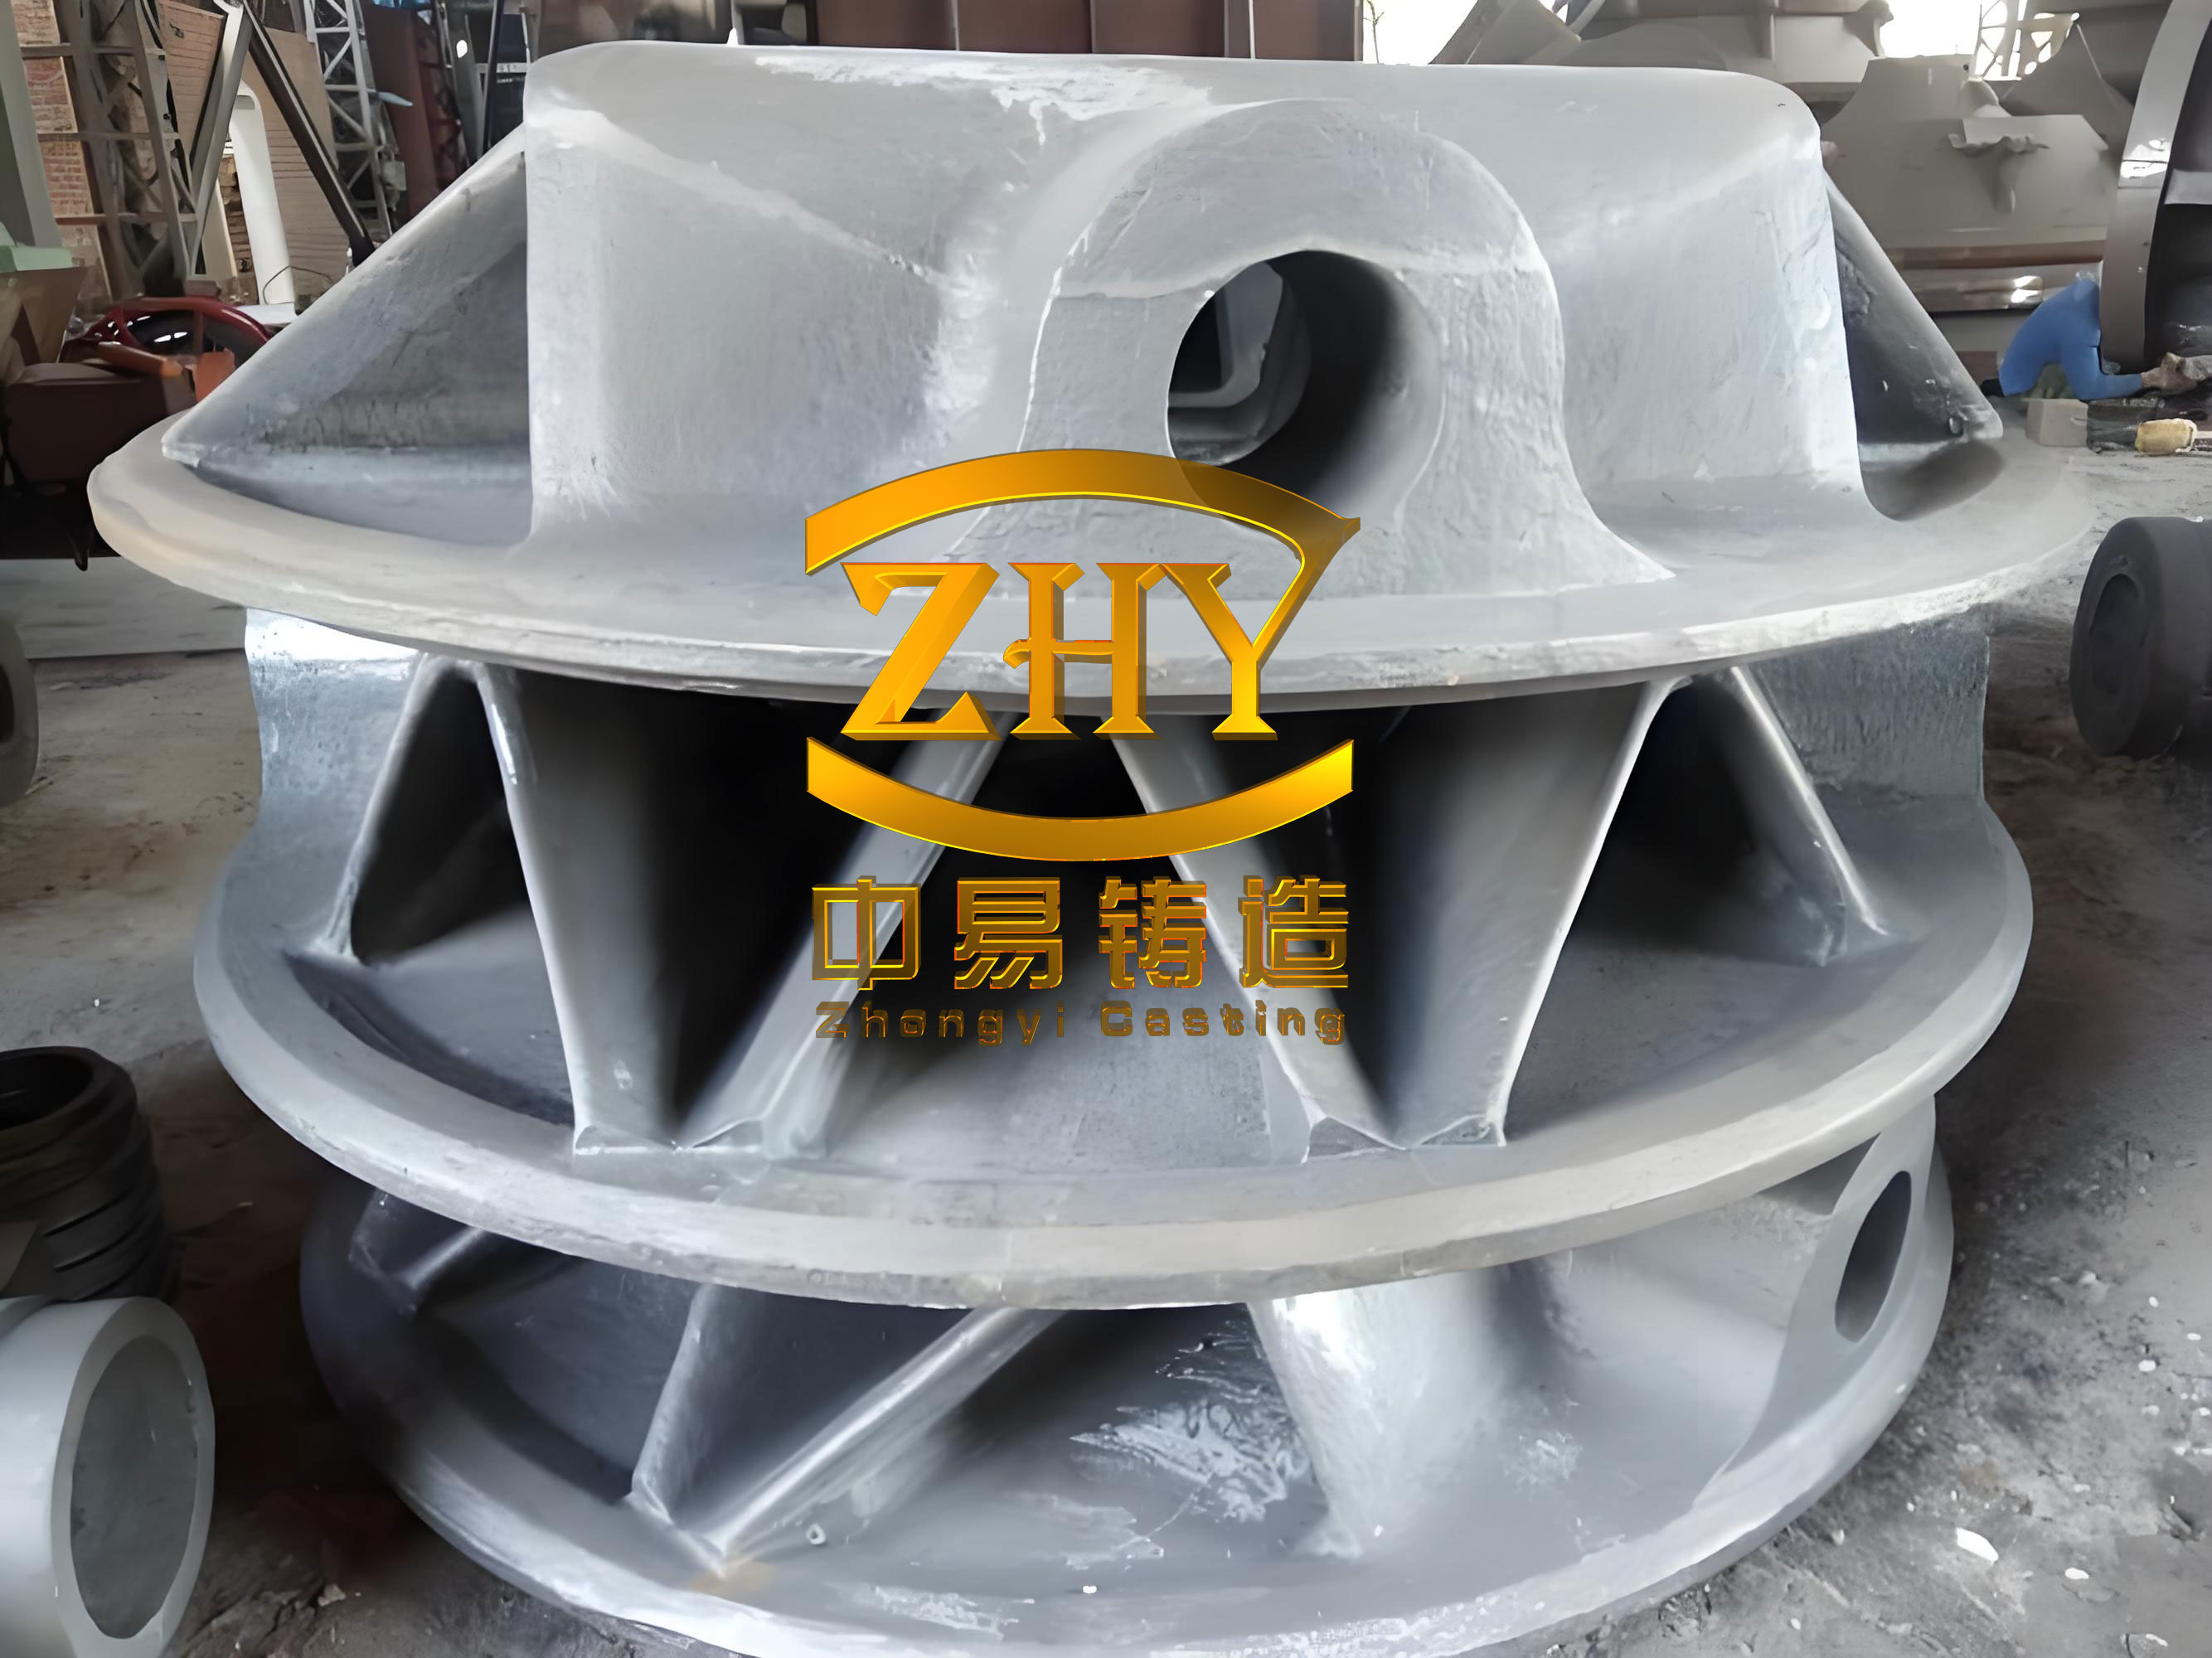
I treat the ductile iron casting as a gravity casting process. The alloy is a spheroidal graphite iron equivalent to QT400-18. The bearing seat has a complex geometry with many fillets, curved surfaces, inclined faces, a large internal cavity, and non-uniform wall thickness. Thin walls, thick walls, and corner regions differ significantly in cooling rate. The top surface and internal arc regions are important functional surfaces, so they are likely to suffer from cracking, shrinkage porosity, or incomplete filling if the ductile iron casting process is not properly designed. Therefore, I establish a numerical model, compare top and bottom pouring systems, optimize the riser, add chills and vents, and then perform a systematic orthogonal study of the ductile iron casting parameters.
1. Physical Model and Material Conditions
The bearing seat used in my ductile iron casting study has a length of 0.321 m, a width of 0.127 m, and a height of 0.099 m. The mass of the casting is 8.34 kg. The geometry is symmetric but complex. It includes a large cavity and several wall-thickness transitions. These features make the filling and solidification behavior non-uniform. I use a sand mold process. The initial pouring temperature is set to 1420 degrees C, the mold temperature is set to 150 degrees C, and the heat transfer coefficient between the casting and the chill is set to 0.1 W/(m K). The mold wall thickness is 0.03 m, and the external mold dimensions are 0.381 m by 0.1871 m by 0.280 m. I place five sensors at important locations such as thin walls and arc sections to monitor thermal history during the ductile iron casting simulation.
The chemical composition of the ductile iron casting is summarized in Table 1. I use the measured values as the baseline for the numerical model. The carbon and silicon contents are selected to promote graphitization and to reduce the risk of chilled iron formation. The magnesium and rare earth contents are kept within a controlled range to ensure nodularity in the ductile iron casting.
| Element | Specified Range (wt.%) | Measured Value (wt.%) |
|---|---|---|
| C | 3.50-3.60 | 3.50 |
| Si | 2.50-3.00 | 3.12 |
| Mn | 0.45-0.57 | 0.14 |
| P | 0.05-0.06 | 0.04 |
| S | 0.01-0.03 | 0.01 |
| Mg | 0.03-0.06 | 0.04 |
| Re | 0.03-0.05 | Not reported |
2. Numerical Model and Governing Equations
I use a SOLA-VOF method for the ductile iron casting simulation. The liquid iron is assumed to be an incompressible Newtonian fluid. The flow is driven by gravity. The model obeys mass conservation, momentum conservation, and energy conservation. I solve the continuity equation, the Navier-Stokes equations, and the energy conservation equation. These equations allow me to predict the free surface evolution, temperature field, and solidification sequence of the ductile iron casting.
The continuity equation for the incompressible melt is
$$
\frac{\partial u}{\partial x}+\frac{\partial v}{\partial y}+\frac{\partial w}{\partial z}=0
$$
where \(u\), \(v\), and \(w\) are the velocity components in the \(x\), \(y\), and \(z\) directions, respectively. The divergence \(D\) is zero for the incompressible ductile iron casting melt.
The momentum conservation equations in three directions are written as
$$
\rho\left(\frac{\partial u}{\partial t}+u\frac{\partial u}{\partial x}+v\frac{\partial u}{\partial y}+w\frac{\partial u}{\partial z}\right)=-\frac{\partial P}{\partial x}+\mu\nabla^2 u
$$
$$
\rho\left(\frac{\partial v}{\partial t}+u\frac{\partial v}{\partial x}+v\frac{\partial v}{\partial y}+w\frac{\partial v}{\partial z}\right)=-\frac{\partial P}{\partial y}+\mu\nabla^2 v
$$
$$
\rho\left(\frac{\partial w}{\partial t}+u\frac{\partial w}{\partial x}+v\frac{\partial w}{\partial y}+w\frac{\partial w}{\partial z}\right)=-\frac{\partial P}{\partial z}+\rho g+\mu\nabla^2 w
$$
Here, \(\rho\) is density, \(P\) is pressure per unit density, \(g\) is gravitational acceleration, \(\mu\) is dynamic viscosity, and \(\nabla^2\) is the Laplacian operator. These equations describe the fluid dynamics of the ductile iron casting during mold filling.
The energy conservation equation is
$$
\rho c\left(\frac{\partial T}{\partial t}+u\frac{\partial T}{\partial x}+v\frac{\partial T}{\partial y}+w\frac{\partial T}{\partial z}\right)=\lambda\left(\frac{\partial^2 T}{\partial x^2}+\frac{\partial^2 T}{\partial y^2}+\frac{\partial^2 T}{\partial z^2}\right)+S
$$
where \(c\) is specific heat capacity, \(T\) is thermodynamic temperature, \(\lambda\) is thermal conductivity, and \(S\) is the heat source term. This equation governs heat transfer and temperature evolution in both the ductile iron casting and the mold.
3. Defect Prediction Criterion
I use the temperature gradient and cooling rate ratio method to predict shrinkage defects in the ductile iron casting. The criterion is based on the local temperature gradient \(G\) and the cooling rate \(R\). When the ratio \(G/\sqrt{R}\) is lower than a critical value, the local region is prone to shrinkage porosity or shrinkage cavity. The criterion is
$$
\frac{G}{\sqrt{R}}\le C
$$
and the cooling rate is calculated as
$$
R=\frac{T_u-T_l}{t_u-t_l}
$$
where \(G\) is the temperature gradient at a selected node, \(R\) is the cooling rate, \(C\) is the critical value related to casting size, \(T_u\) is the liquidus temperature, \(T_l\) is the solidus temperature, \(t_u\) is the time at the liquidus temperature, and \(t_l\) is the time at the solidus temperature. I apply this criterion to the ductile iron casting to identify isolated liquid regions and potential shrinkage defects.
4. Mesh Independence Study
I performed a mesh independence study to ensure that the numerical results of the ductile iron casting are not dominated by mesh size. I compared mesh sizes of 1 mm, 2 mm, 4 mm, 6 mm, 8 mm, and 16 mm. The pouring temperature was 1400 degrees C and the mold temperature was 125 degrees C. When the mesh size was below 6 mm, the filling time increased slowly as the mesh became finer. The 4 mm mesh produced results close to those from the 2 mm and 1 mm meshes. Considering both computational cost and accuracy, I selected a uniform 6 mm mesh for the subsequent ductile iron casting simulations. With this mesh, the meshing time was 0.372 s, the number of surface elements was 23,294, and the total number of mesh cells was 1,451,034.
| Mesh Size (mm) | Relative Filling Time | Numerical Behavior | Decision |
|---|---|---|---|
| 16 | Shortest | Too coarse for thin walls | Rejected |
| 8 | Short | Limited resolution near curvatures | Rejected |
| 6 | Moderate | Good balance of speed and accuracy | Selected |
| 4 | Slightly longer | Close to finer meshes | Reference |
| 2 | Longer | High computational cost | Reference |
| 1 | Longest | Very high computational cost | Reference |
5. Initial Pouring System Design
I designed the pouring system as the main path for liquid iron to enter the mold cavity. For the ductile iron casting, I assumed a process yield of 70 percent. The mass of the pouring system and risers was 3.57 kg. The total mass of metal in the mold cavity was 11.91 kg. The average wall thickness of the casting was 6.5 mm. The pouring time was 7.6 s, and the filling time was 4.4 s. The calculated rising speed was 22.73 mm/s, which satisfies the required range of 19 to 30 mm/s. For a closed pouring system, the cross-sectional ratio of the ingate, runner, and sprue was set to 1:1.2:1.5. This design provides a controlled flow rate and reduces turbulence during the ductile iron casting process.
| Parameter | Value |
|---|---|
| Process yield | 70% |
| Mass of pouring system and risers | 3.57 kg |
| Total metal mass in mold cavity | 11.91 kg |
| Average wall thickness | 6.5 mm |
| Pouring time | 7.6 s |
| Filling time | 4.4 s |
| Rising speed | 22.73 mm/s |
| Required rising speed | 19-30 mm/s |
| Ingate:Runner:Sprue area ratio | 1:1.2:1.5 |
6. Comparison of Top Pouring and Bottom Pouring
I compared a top pouring system and a bottom pouring system for the ductile iron casting. The comparison focused on filling time, temperature distribution, turbulence, air entrapment, and solidification behavior. The process schemes are listed in Table 4. Scheme 1 used a top pouring system without a riser. Scheme 2 used a top pouring system with a riser. Scheme 3 used a bottom pouring system with a riser. Scheme 4 used a top pouring system with a riser under different thermal conditions.
| Scheme | Filling Temperature (degrees C) | Filling Speed (m/s) | Mold Preheat Temperature (degrees C) | Riser |
|---|---|---|---|---|
| 1 | 1400 | 0.50 | 125 | No |
| 2 | 1400 | 0.50 | 125 | Yes |
| 3 | 1380 | 0.40 | 100 | Yes |
| 4 | 1420 | 0.60 | 150 | Yes |
For the top pouring system, the filling process showed small fluctuations. At 25.01 percent filling, the top pouring time was 2.60 s, while the bottom pouring time was 1.32 s. The bottom pouring system filled more smoothly. It showed no large waves or splashing. The minimum bottom temperature was 1375 degrees C for bottom pouring and 1325 degrees C for top pouring. In the top pouring case, there were three locations where air entrapment could occur. At 50.01 percent filling, the top pouring time was 5.19 s, and the bottom pouring time was 2.70 s. Both systems filled relatively stably, but the top pouring system had lower temperatures by about 50 degrees C. At 75 percent filling, the top pouring time was 7.82 s and the bottom pouring time was 4.08 s. The top and bottom pouring systems completed filling at 10.64 s and 5.44 s, respectively. The bottom pouring system filled much faster than the top pouring system. The top pouring system had a smaller temperature gradient, but the pouring system cooled faster than the casting. Therefore, the top pouring system could not rely on the pouring system for feeding, and a riser was necessary.
| Filling Stage | Top Pouring Time (s) | Bottom Pouring Time (s) | Top Pouring Minimum Temperature (degrees C) | Bottom Pouring Minimum Temperature (degrees C) | Observation |
|---|---|---|---|---|---|
| 25.01% | 2.60 | 1.32 | 1325 | 1375 | Top pouring showed possible air entrapment |
| 50.01% | 5.19 | 2.70 | About 50 degrees C lower | Higher | Both stable |
| 75.00% | 7.82 | 4.08 | Lower | Higher | Bottom pouring faster |
| 100.00% | 10.64 | 5.44 | Below 1250 | Below 1300 | Bottom pouring completed earlier |
7. Solidification Behavior
I simulated the solidification process for both pouring systems. The ductile iron casting solidified from the outside inward. The peak temperature region was located in the thick wall of the casting. For the top pouring system, at \(t=57.55\) s, the solid fraction reached 25.95 percent. For the bottom pouring system, at \(t=57.9\) s, the solid fraction reached 26.47 percent. The top pouring and bottom pouring systems completed solidification at 502 s and 440 s, respectively. Although the bottom pouring system solidified faster, it could not feed the top region effectively. Even with two pouring cups, the filling speed was almost twice that of the top pouring system, and the filling process was more complex. Therefore, I continued with the top pouring system for further optimization of the ductile iron casting.
| Solidification Stage | Top Pouring | Bottom Pouring |
|---|---|---|
| Time to 25% solid fraction | 57.55 s | 57.9 s |
| Solid fraction at that time | 25.95% | 26.47% |
| Complete solidification time | 502 s | 440 s |
| Feeding capability to top region | Better with riser | Poor |
| Process complexity | Moderate | High |
8. Initial Defect Analysis
I completed simulations for schemes 2, 3, and 4. In the case with a pouring temperature of 1420 degrees C and a pouring speed of 0.6 m/s, the number of defects after solidification was relatively small. The defects were mainly concentrated on the inner surface. However, an isolated liquid region was observed in the internal marked region. This region formed a hot spot because of its locally larger thickness. During solidification, it did not receive sufficient feeding, which led to shrinkage porosity in the ductile iron casting.
9. Optimization with Chills, Risers, and Venting
For ductile iron castings with a relatively large modulus, the solidification time can be long. A long solidification time may reduce the nodularity of graphite and increase the probability of coarse graphite and graphite distortion. Therefore, I used chills to reduce the solidification time. I selected external cast iron chills and controlled the spacing between them at 20 to 30 mm. At the bottom of the casting, the region below the ingate formed an overheated zone because of continuous filling. This zone caused shrinkage porosity. I added a chill in that region to enlarge the cooling area. To accelerate cooling of the thick wall region, that is, the isolated liquid region, and to discharge gases from the mold cavity, I added an extraction-type blind vent at the side of the thick wall. I also optimized the size of the cylindrical pressure riser. The optimized pouring system reduced the defect volume fraction and improved the quality of the ductile iron casting.
Using scheme 4, I compared the feeding behavior before and after optimization. After optimization, the shrinkage cavity appeared entirely in the riser. The casting itself had good formability. The arc surface and other external surfaces were essentially free of defects. Internal defects in the thick wall region were largely eliminated by the chilling and feeding effects. This confirmed that the combination of chills, riser optimization, and venting is effective for the ductile iron casting.
| Optimization Measure | Purpose | Result |
|---|---|---|
| External cast iron chills | Increase cooling rate in thick sections | Reduced hot spots |
| Chill spacing 20-30 mm | Control cooling uniformity | Balanced solidification |
| Bottom chill near ingate | Reduce overheated zone | Reduced shrinkage porosity |
| Blind vent at thick wall | Discharge gases | Reduced gas entrapment |
| Cylindrical pressure riser | Improve feeding | Shrinkage moved into riser |
10. Orthogonal Simulation Design
I designed an orthogonal simulation experiment to study the effects of pouring temperature, mold temperature, and pouring speed on the defect volume fraction in the ductile iron casting. The factors and levels are listed in Table 7. Factor A is pouring temperature in degrees C. Factor B is mold temperature in degrees C. Factor C is pouring speed in m/s. I used a Box-Behnken design. When the variable factors and levels were entered into the design software, it generated 17 test schemes, including 5 center repeated tests. This design is economical because it does not require continuous repeated trials at the same factor combination.
| Level | Pouring Temperature A (degrees C) | Mold Temperature B (degrees C) | Pouring Speed C (m/s) |
|---|---|---|---|
| Level 1 | 1380 | 100 | 0.05 |
| Level 2 | 1400 | 125 | 0.06 |
| Level 3 | 1420 | 150 | 0.07 |
The Box-Behnken test matrix and the measured defect volume fraction \(Y_1\) are shown in Table 8. The response \(Y_1\) is the defect volume fraction in percent. I used these data to build a regression model for the ductile iron casting process.
| Run | A: Pouring Temperature (degrees C) | B: Mold Temperature (degrees C) | C: Pouring Speed (m/s) | Y1: Defect Volume Fraction (%) |
|---|---|---|---|---|
| 1 | 1400 | 150 | 0.05 | 0.574 |
| 2 | 1380 | 125 | 0.05 | 0.426 |
| 3 | 1400 | 125 | 0.06 | 0.550 |
| 4 | 1400 | 150 | 0.07 | 0.457 |
| 5 | 1380 | 125 | 0.07 | 0.372 |
| 6 | 1420 | 125 | 0.07 | 0.663 |
| 7 | 1400 | 100 | 0.07 | 0.424 |
| 8 | 1400 | 125 | 0.06 | 0.543 |
| 9 | 1400 | 150 | 0.06 | 0.517 |
| 10 | 1420 | 100 | 0.06 | 0.596 |
| 11 | 1400 | 125 | 0.05 | 0.577 |
| 12 | 1420 | 125 | 0.05 | 0.678 |
| 13 | 1380 | 150 | 0.06 | 0.461 |
| 14 | 1420 | 150 | 0.06 | 0.727 |
| 15 | 1380 | 100 | 0.06 | 0.411 |
| 16 | 1400 | 100 | 0.05 | 0.424 |
| 17 | 1420 | 125 | 0.06 | 0.565 |
11. Regression Model for Defect Volume Fraction
I fitted a quadratic regression model to the defect volume fraction of the ductile iron casting. The coded regression equation is
$$
Y_1 = 0.5504 + 0.1243A + 0.0455B – 0.0232C + 0.0202AB + 0.0098AC – 0.0292BC + 0.0317A^2 – 0.0333B^2 – 0.0473C^2
$$
In this equation, \(A\), \(B\), and \(C\) are the coded factors for pouring temperature, mold temperature, and pouring speed, respectively. The positive coefficients for \(A\) and \(B\) indicate that increasing pouring temperature or mold temperature tends to increase the defect volume fraction in the ductile iron casting. The negative coefficient for \(C\) indicates that increasing pouring speed tends to reduce the defect volume fraction, although the effect is weaker than that of pouring temperature.
12. Analysis of Variance and Model Adequacy
I used analysis of variance to evaluate the suitability of the model. The results are shown in Table 9. The model is highly significant because \(P<0.0001\). The lack-of-fit is not significant, which means that the model can predict the influence direction of the test factors on the response index. The factor \(A\), that is, pouring temperature, is the most significant factor affecting the defect volume fraction. The factor \(B\), mold temperature, is the second most significant factor. The factor \(C\), pouring speed, is also significant at the 0.05 level. The interaction \(BC\) is significant, while \(AB\) and \(AC\) are not as significant. The quadratic terms \(A^2\), \(B^2\), and \(C^2\) are all significant, indicating that the response surface has curvature.
| Source | Sum of Squares | Degrees of Freedom | Mean Square | F Value | P Value | Significance |
|---|---|---|---|---|---|---|
| Model | 0.1678 | 9 | 0.0186 | 37.970 | <0.0001 | Significant |
| A | 0.1235 | 1 | 0.1235 | 251.490 | <0.0001 | Significant |
| B | 0.0166 | 1 | 0.0166 | 33.720 | 0.0007 | Significant |
| C | 0.0043 | 1 | 0.0043 | 8.810 | 0.0209 | Significant |
| AB | 0.0016 | 1 | 0.0016 | 3.340 | 0.1103 | Not significant |
| AC | 0.0004 | 1 | 0.0004 | 0.774 | 0.4081 | Not significant |
| BC | 0.0034 | 1 | 0.0034 | 6.970 | 0.0334 | Significant |
| A2 | 0.0042 | 1 | 0.0042 | 8.600 | 0.0219 | Significant |
| B2 | 0.0047 | 1 | 0.0047 | 9.520 | 0.0177 | Significant |
| C2 | 0.0094 | 1 | 0.0094 | 19.200 | 0.0032 | Significant |
| Residual | 0.0034 | 7 | 0.0005 | |||
| Lack of Fit | 0.0013 | 3 | 0.0004 | 0.8585 | 0.5312 | Not significant |
| Pure Error | 0.0021 | 4 | 0.0005 | |||
| Total | 0.1712 | 16 |
The model fit statistics are shown in Table 10. The standard deviation is 0.0222, the mean is 0.5274, and the coefficient of variation is 4.20 percent. A coefficient of variation below 10 percent is within a reasonable range. The determination coefficient \(R^2\) is 0.9799, and the adjusted \(R^2\) is 0.9541. Both are greater than 0.9, indicating that the model has high reliability for the ductile iron casting process. The predicted \(R^2\) is 0.8551, and the signal-to-noise ratio is 21.2543, which further supports the adequacy of the model.
| Statistic | Value |
|---|---|
| Standard deviation | 0.0222 |
| Mean | 0.5274 |
| Coefficient of variation | 4.20% |
| R-squared | 0.9799 |
| Adjusted R-squared | 0.9541 |
| Predicted R-squared | 0.8551 |
| Signal-to-noise ratio | 21.2543 |
13. Response Surface Interpretation
I analyzed the response surfaces for the defect volume fraction. The normal probability plot of residuals followed a straight line, which means that the residuals are normally distributed. The predicted response and the actual values were linearly distributed. These diagnostics support the validity of the regression model for the ductile iron casting.
When the pouring speed \(C\) was at the middle level, the response surface of \(Y_1\) with respect to pouring temperature \(A\) and mold temperature \(B\) showed the following behavior. When \(B\) was between 100 and 125 degrees C, \(Y_1\) first increased and then slightly decreased as \(A\) increased. When \(B\) was between 125 and 150 degrees C, \(Y_1\) increased as \(A\) increased. Overall, \(Y_1\) increased with increasing \(A\), and within the selected range, the effect of \(A\) was greater than that of \(B\). This indicates that reducing the pouring temperature is an effective way to reduce the defect volume fraction in the ductile iron casting.
When considering \(A\) and \(C\), \(Y_1\) increased with increasing \(A\). When \(C\ge 0.06\) m/s, the change in \(Y_1\) was greater than when \(C<0.06\) m/s. When \(A\) was moderate and \(C\) was greater than 0.06 m/s, the result was optimal. This suggests that increasing the pouring speed can reduce the defect rate, but the effect is limited. When considering \(B\) and \(C\), both factors had a strong influence on \(Y_1\). However, when \(B>125\) degrees C and \(C>0.06\) m/s, the influence on \(Y_1\) was smaller. The steepness of the curves indicates that the effect of \(C\) was greater than that of \(B\) in that region.
From the response surface analysis, I conclude that the influence of pouring temperature, mold temperature, and pouring speed on the defect volume fraction decreases in that order within the selected range. In defect optimization, reducing pouring temperature or reducing mold temperature is the most effective approach. In addition, appropriately increasing the pouring speed is beneficial for reducing defects. However, because pouring speed has a relatively small effect on defects, I can reduce the pouring speed to the lowest level in the selected range when production efficiency is considered. At the optimal pouring temperature, this lower pouring speed still produces stable filling and solidification, and the ductile iron casting performance is best.
14. Optimization Result and Validation
The optimization result I obtained is a pouring temperature of 1400 degrees C, a mold temperature of 145 degrees C, and a pouring speed of 0.061 m/s. Under these conditions, the defect volume fraction is 0.556 percent. I simulated this optimized ductile iron casting process and compared it with the initial design. The arc surface and other external surfaces were essentially free of defects. In the interior, the defects in the thick wall region, that is, the isolated liquid region, were largely eliminated by the chilling and feeding effects. The optimized process therefore provides a better ductile iron casting with reduced shrinkage porosity and improved structural integrity.
| Optimized Parameter | Value |
|---|---|
| Pouring temperature | 1400 degrees C |
| Mold temperature | 145 degrees C |
| Pouring speed | 0.061 m/s |
| Predicted defect volume fraction | 0.556% |
| External surface quality | Arc and other surfaces essentially defect-free |
| Internal thick-wall defects | Largely eliminated by chills and feeding |
15. Discussion of Defect Formation in Ductile Iron Casting
The results of my study show that the ductile iron casting process is sensitive to thermal conditions. Pouring temperature is the most significant factor because it controls the initial superheat of the liquid iron. A higher pouring temperature increases the total heat content of the melt. This delays solidification, enlarges the hot spot, and increases the tendency for shrinkage porosity. A lower pouring temperature reduces the heat load on the mold and promotes more uniform solidification. However, if the pouring temperature is too low, the ductile iron casting may suffer from cold shuts, incomplete filling, or poor graphite nodularity. Therefore, an optimum pouring temperature exists.
Mold temperature is the second most significant factor. A higher mold temperature reduces the cooling rate of the ductile iron casting. This can improve filling of thin sections, but it also prolongs solidification and increases the risk of shrinkage defects. A lower mold temperature increases the cooling rate and can refine the microstructure, but it may cause premature freezing in thin walls. In my orthogonal tests, both pouring temperature and mold temperature were positively correlated with the defect volume fraction. This means that increasing either factor tends to increase the defect volume fraction in the ductile iron casting.
Pouring speed has a smaller effect on the defect volume fraction. A higher pouring speed can shorten the filling time and reduce the temperature drop of the liquid iron. This can be beneficial for thin walls. However, an excessively high pouring speed can cause turbulence, air entrapment, and mold erosion. The response surface analysis showed that increasing pouring speed from 0.05 to about 0.06-0.07 m/s can reduce the defect volume fraction, but the benefit is limited. In the optimized ductile iron casting, I selected a pouring speed of 0.061 m/s, which is near the lower end of the selected range. This provides stable filling and solidification while maintaining good casting performance.
16. Role of Chills, Risers, and Vents in Ductile Iron Casting
Chills play an important role in the ductile iron casting because they increase the local cooling rate. In my work, external cast iron chills were placed at thick sections and at the bottom region below the ingate. The chill spacing was controlled between 20 and 30 mm. This spacing allowed the chills to extract heat effectively without causing excessive temperature gradients. The bottom chill reduced the overheated zone that formed during continuous filling. The chill at the thick wall accelerated cooling of the isolated liquid region and reduced the shrinkage porosity. These measures improved the soundness of the ductile iron casting.
Risers provide feeding during solidification. In the initial design, the top pouring system had a small temperature gradient, but the pouring system cooled faster than the casting. Therefore, the pouring system alone could not feed the ductile iron casting. I optimized the cylindrical pressure riser so that the shrinkage cavity formed in the riser rather than in the casting. After optimization, the shrinkage cavity was entirely located in the riser, and the casting had good formability. This result confirms that riser optimization is essential for a sound ductile iron casting.
Venting is also important because gas entrapment can cause porosity and incomplete filling. I added an extraction-type blind vent at the thick wall side. This vent helped discharge gases from the mold cavity during filling. The combination of chills, riser optimization, and venting reduced both shrinkage and gas-related defects in the ductile iron casting.
17. Practical Implications for Ductile Iron Casting Design
My study provides several practical implications for ductile iron casting design. First, the pouring temperature should be carefully controlled. In this bearing seat application, the optimal pouring temperature was 1400 degrees C. At this temperature, the defect volume fraction was lower than at 1420 degrees C. Second, the mold temperature should be kept at a moderate level. A mold temperature of 145 degrees C was selected in the optimized process. Third, the pouring speed should be selected to balance filling stability and defect reduction. A pouring speed of 0.061 m/s was sufficient to fill the thin walls without introducing excessive turbulence.
Fourth, the pouring system should be designed to avoid turbulence and air entrapment. The top pouring system was selected because it provided feeding space for the riser. The bottom pouring system filled faster, but it could not feed the top region effectively, and its filling process was more complex. Fifth, chills should be placed at hot spots and overheated zones. The chill spacing should be controlled to avoid excessive thermal gradients. Sixth, the riser should be optimized so that the final shrinkage cavity is located in the riser, not in the ductile iron casting. Seventh, venting should be provided to remove gases from the mold cavity.
18. Summary of Key Quantitative Results
Table 12 summarizes the key quantitative results from my ductile iron casting study. These results include filling times, solidification times, optimal parameter values, and defect volume fractions. They provide a compact overview of the process optimization.
| Quantity | Value or Result |
|---|---|
| Casting mass | 8.34 kg |
| Total metal mass in mold | 11.91 kg |
| Average wall thickness | 6.5 mm |
| Top pouring filling time | 10.64 s |
| Bottom pouring filling time | 5.44 s |
| Top pouring solidification time | 502 s |
| Bottom pouring solidification time | 440 s |
| Most significant factor | Pouring temperature |
| Second most significant factor | Mold temperature |
| Optimal pouring temperature | 1400 degrees C |
| Optimal mold temperature | 145 degrees C |
| Optimal pouring speed | 0.061 m/s |
| Predicted defect volume fraction | 0.556% |
| Selected mesh size | 6 mm |
| Number of orthogonal runs | 17 |
19. Comparison of Factor Effects
I compared the relative effects of the three factors on the defect volume fraction. The range analysis and variance analysis both showed that pouring temperature \(A\) has the largest effect. Mold temperature \(B\) has the second largest effect. Pouring speed \(C\) has the smallest effect among the three factors. The significance order is
$$
A > B > C
$$
for the defect volume fraction in the ductile iron casting. The positive correlation between \(A\) and \(Y_1\), and between \(B\) and \(Y_1\), indicates that lower pouring temperature and lower mold temperature are beneficial for reducing defects, provided that filling remains complete. The negative correlation between \(C\) and \(Y_1\) indicates that increasing pouring speed can reduce defects, but the effect is weaker. In practical production, the pouring speed can be reduced to the lowest level in the selected range when the pouring temperature is optimal, because this ensures stable filling and solidification.
20. Final Remarks on Numerical Simulation of Ductile Iron Casting
The numerical simulation of the ductile iron casting allowed me to evaluate the filling and solidification behavior before actual production. By using the continuity equation, the Navier-Stokes equations, and the energy conservation equation, I was able to predict the temperature field, the free surface evolution, and the defect-prone regions. The temperature gradient and cooling rate ratio criterion provided a practical method for predicting shrinkage defects. The orthogonal test design allowed me to study the combined effects of pouring temperature, mold temperature, and pouring speed with a limited number of simulation runs.
The results show that the ductile iron casting process can be optimized by reducing the pouring temperature, controlling the mold temperature, and selecting an appropriate pouring speed. Chills, risers, and vents further improve the casting quality. The optimized ductile iron casting has a lower defect volume fraction, fewer internal defects, and better surface quality. This study provides theoretical guidance for optimizing the casting process parameters of ductile iron bearing seats and similar components.
21. Conclusions
I draw the following conclusions from my numerical analysis and orthogonal tests of the ductile iron casting process for a bearing seat.
1. The top pouring system has a longer filling time than the bottom pouring system, but it provides feeding space. Therefore, the top pouring system with a properly designed riser produces fewer defects in the ductile iron casting.
2. Reasonable addition of chills and a venting system, together with riser optimization, can reduce casting defects. The chills accelerate cooling in thick sections and overheated zones, the vent removes gases, and the optimized riser confines the final shrinkage cavity to the riser.
3. The range analysis and variance analysis of the orthogonal tests show that pouring temperature is the most significant factor affecting the defect volume fraction, followed by mold temperature. Both factors are positively correlated with the defect volume fraction in the ductile iron casting.
4. At the optimal pouring temperature, the pouring speed can be reduced to the lowest level within the selected range. At this condition, the filling and solidification processes are stable, and the ductile iron casting performance is best.
5. The optimized process parameters for the ductile iron casting are a pouring temperature of 1400 degrees C, a mold temperature of 145 degrees C, and a pouring speed of 0.061 m/s. Under these conditions, the predicted defect volume fraction is 0.556 percent, and the internal defects in the thick wall region are largely eliminated.
These findings can guide the design and optimization of ductile iron casting processes for bearing seats and other thick-thin wall transition components. I recommend using numerical simulation together with orthogonal experimental design to reduce trial-and-error, shorten development time, and improve the quality of ductile iron castings.