
I optimized the precision casting process for a low-carbon steel forklift head that forms part of a fork assembly. The geometry is a hollow, side-enclosing, thin-wall structure, and it is joined to other components by welding. Because welding performance is critical, I kept the material as a low-carbon alloy steel with good weldability. To meet the structural and profile dimensional accuracy requirements, I selected precision casting as the production route. The material requirements are summarized in the following table.
| Carbon content (%) | Yield strength (MPa) | Tensile strength (MPa) | Elongation (%) |
|---|---|---|---|
| 0.18–0.22 | 240 | 450–700 | 22 |
I recognized early that the low carbon content gives the alloy high toughness. This is beneficial for service performance, but it creates a difficult finishing problem. When the same material had been used previously, the inner gate area did not fracture easily during hammer knock-off. Repeated hammer strikes produced impact marks and local damage. As a result, earlier products of similar material were cleaned by flame cutting, which increased cost and reduced efficiency. My objective in this precision casting project was therefore to use casting simulation and gating optimization to achieve reliable hammer knock-off without sacrificing feeding quality.
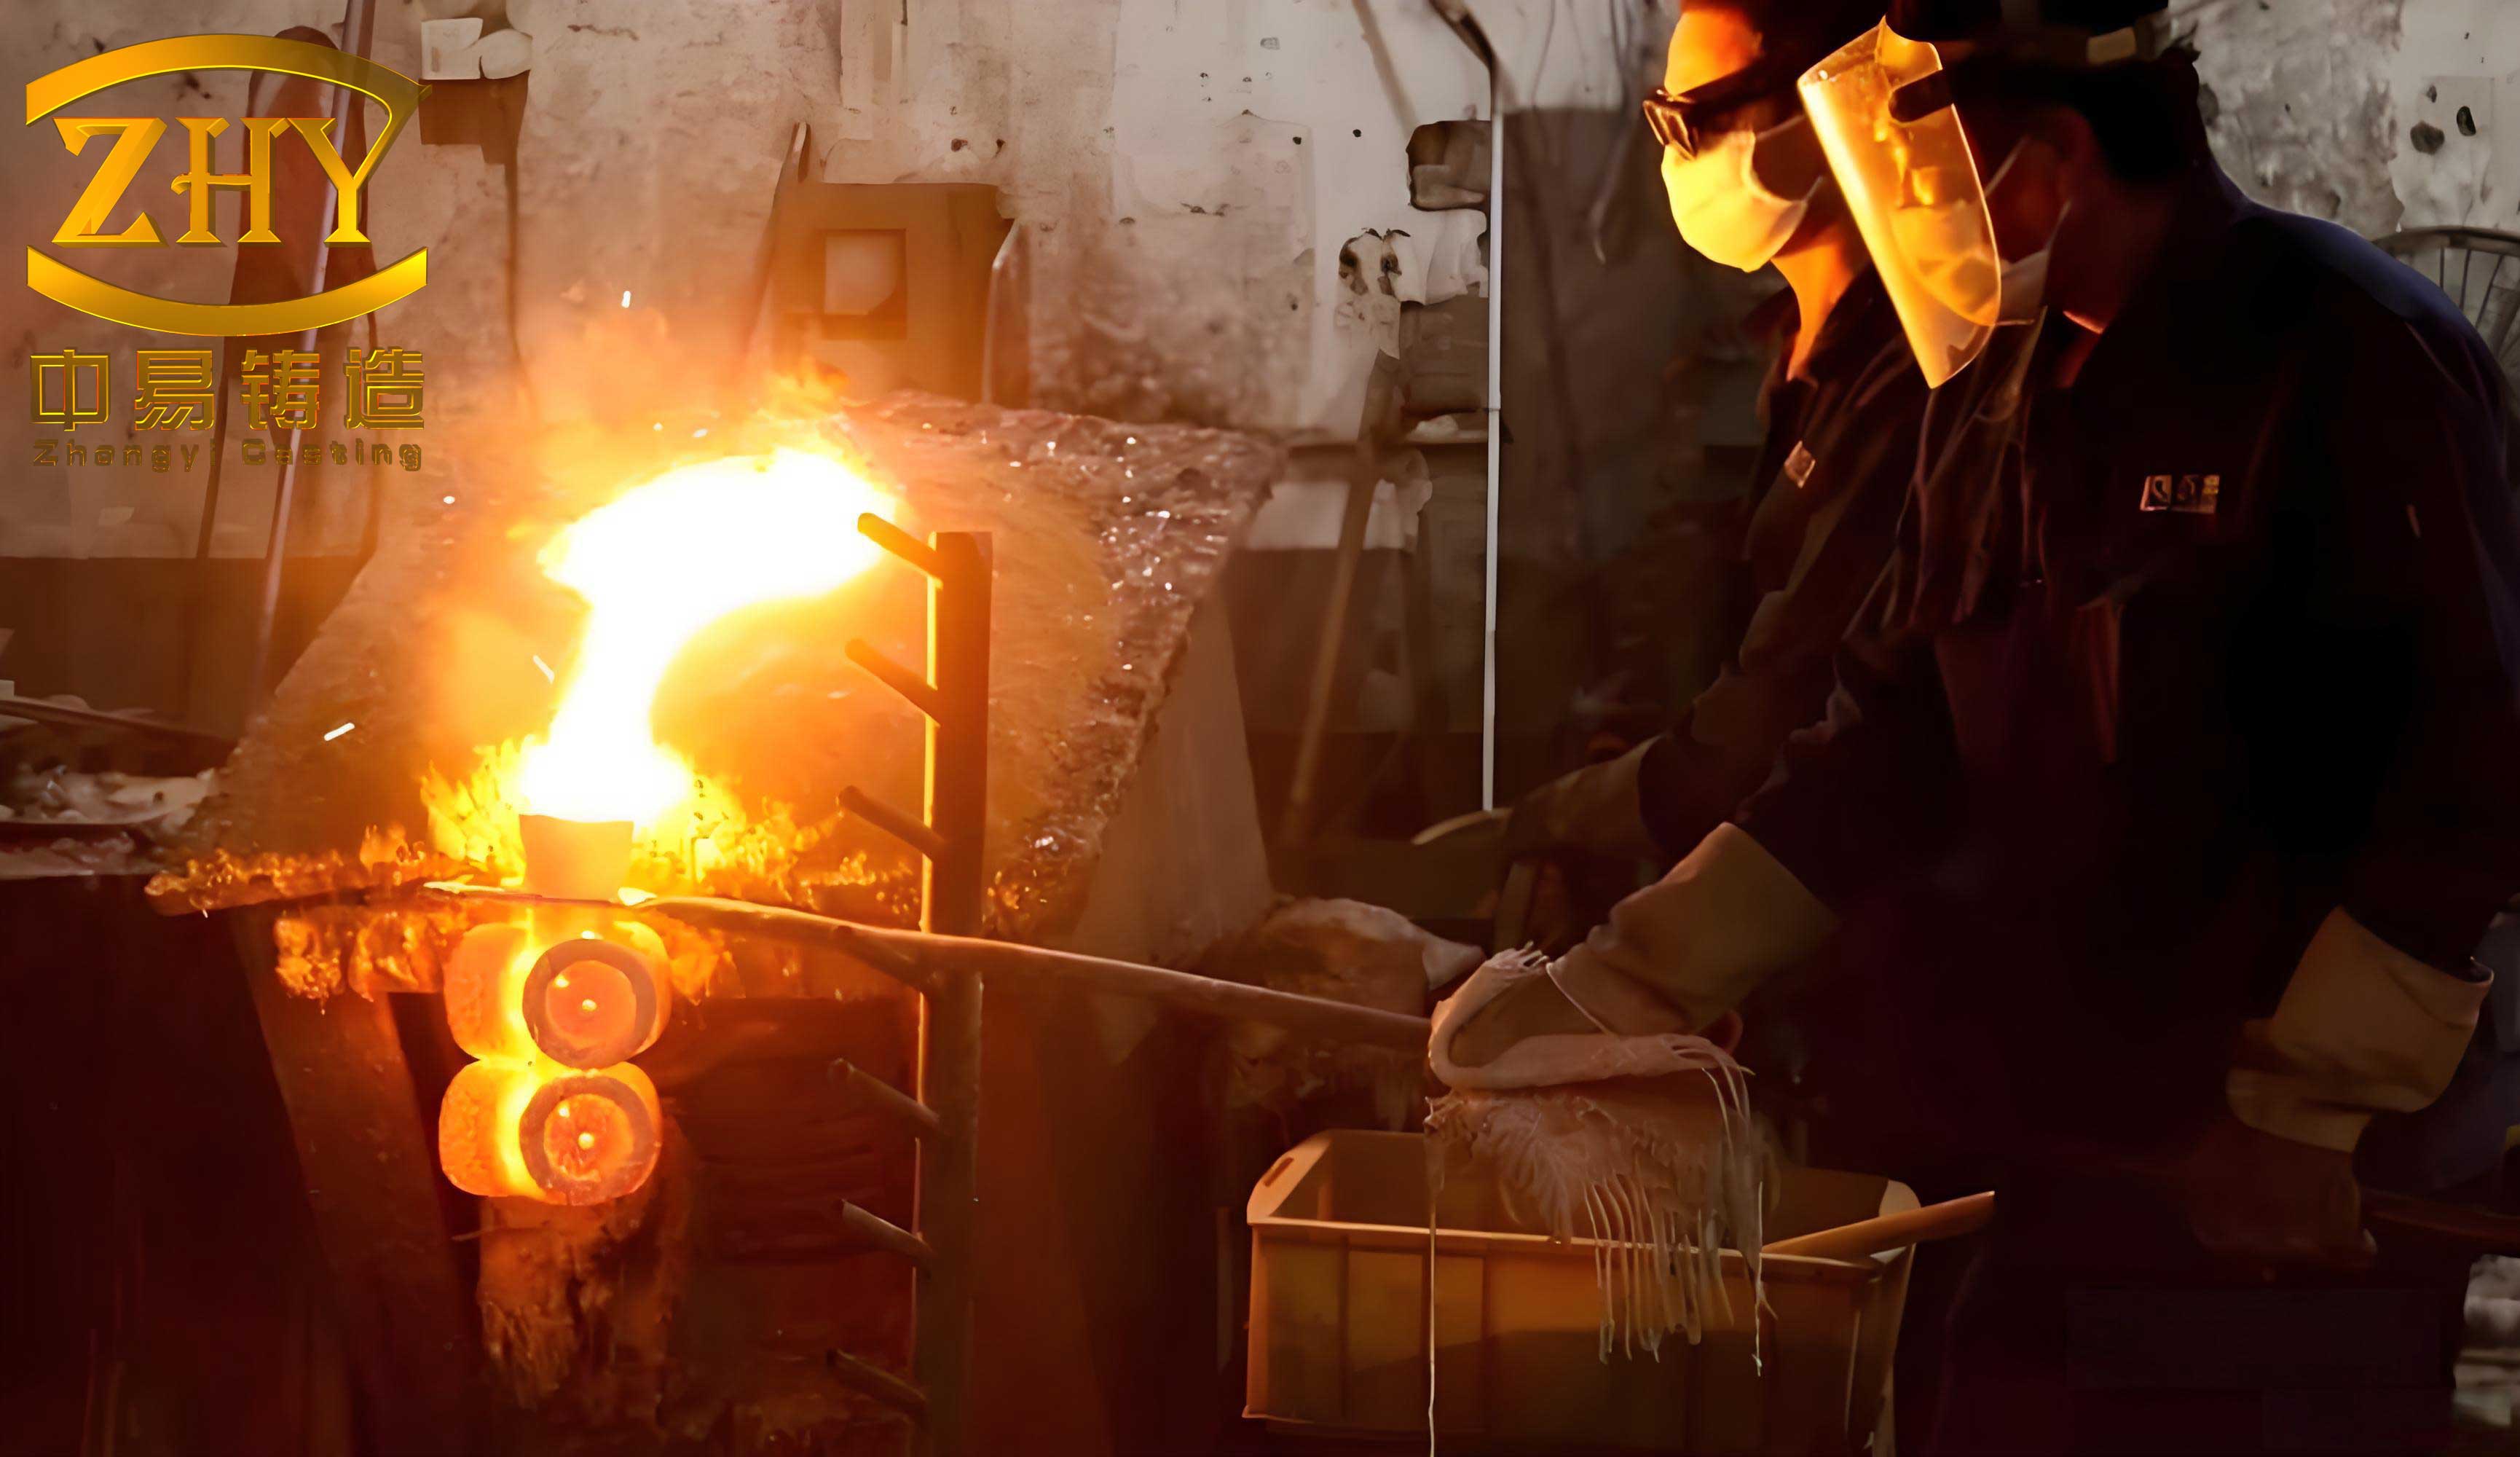
The casting has a relatively uniform wall thickness. I selected a single transverse runner and inner gate gating system. The design method was the sprue cup feeding capacity method. This method treats a casting as a set of equivalent cylindrical bodies related to its hot spots. The diameter of each equivalent cylinder is the equivalent hot spot diameter. When the inner gate length is in the range of 10 mm to 15 mm, the inner gate equivalent hot spot diameter \(D_g\) has a linear relationship with the casting hot spot equivalent diameter \(D_c\). I used the following relationship:
$$D_g = k D_c$$
In this equation, \(D_c\) is the equivalent hot spot diameter at the casting hot spot, expressed in millimeters. When the hot spot cross-section is rectangular with dimensions \(a \times b\), I obtained \(D_c\) from the equivalent hot spot calculation chart. The factor \(k\) is the weight factor, obtained from the weight factor calculation chart. The weight factor depends on \(G\), which is the mass of the casting feeding zone assigned to one inner gate. When a casting has multiple hot spots and multiple inner gates, I divided the casting into feeding zones and used the mass of the zone supported by each gate.
For this forklift head, the hot spot cross-sections at the critical locations were approximately 15 mm × 75 mm. The weight of the casting feeding zone supported by a single inner gate was 600 g. From the equivalent hot spot chart, I obtained \(D_c = 23\) mm. Substituting this value into the weight factor chart gave \(k = 0.93\). I then calculated the inner gate equivalent hot spot diameter as follows:
$$D_g = k D_c = 0.93 \times 23 = 21.39 \ \text{mm}$$
Because of the local casting structure, I could not place a round inner gate with a diameter of 21.39 mm at the hot spot. I therefore changed the gate to a rectangular section of 22 mm × 20 mm. This section retained the required feeding area while fitting the available space. The inner gate area can be expressed as:
$$A_g = 22 \times 20 = 440 \ \text{mm}^2$$
To make hammer knock-off practical, I designed a sharp neck in the direction of fracture loading. This neck creates stress concentration. Under impact, the neck deforms locally and then fractures completely at the neck. I did not add a neck in the other direction because it had little influence on hammer knock-off and because adding it would increase the number of mold inserts. Based on prior experience, I set the neck angle to 75°. To reduce the risk of missing material on the casting body when fracture occurs at the neck, I placed a 1.5 mm root allowance below the inner gate neck. The key inner gate design values are listed below.
| Design item | Value |
|---|---|
| Hot spot section at critical locations | Approximately 15 mm × 75 mm |
| Mass of feeding zone per inner gate | 600 g |
| Equivalent hot spot diameter, \(D_c\) | 23 mm |
| Weight factor, \(k\) | 0.93 |
| Theoretical inner gate diameter, \(D_g\) | 21.39 mm |
| Selected inner gate section | 22 mm × 20 mm |
| Neck angle | 75° |
| Root allowance below neck | 1.5 mm |
For the transverse runner, the sprue cup feeding capacity method assumes that the runner does not perform feeding. It acts only as a feeding channel. As long as the feeding path remains open, the runner cross-section should be as small as practical. I used the following sizing condition:
$$D_k \ge (1.15 \sim 1.25) D_g$$
Here, \(D_k\) is the equivalent hot spot diameter of the transverse runner cross-section. Using the calculated and selected gate values, and also considering the actual core dimensions and the inner gate welding surface dimensions used in production, I selected \(D_k = 35\) mm. This value provided a robust feeding path while avoiding an unnecessarily heavy runner.
In a single transverse runner gating system based on sprue cup feeding, the sprue cup is the main feeding source. It must contain enough liquid metal for feeding, but it should not be oversized. I reviewed the standard dimensions for a single transverse runner system with a square runner section. The relevant selection table is shown below in a condensed form.
| \(D_k\) (mm) | \(D_1\) (mm) | \(D_2\) (mm) | \(K\) (mm) | \(H\) (mm) | \(L\) (mm) | \(D\) (mm) |
|---|---|---|---|---|---|---|
| 25 | 25 | 20 | 25 | 25 | 50, 60, 70, 80 | 50, 60, 70, 80 |
| 30 | 30 | 25 | 30 | 30 | 60, 70, 80, 90 | 60, 70, 80, 90 |
| 35 | 35 | 30 | 35 | 35 | 70, 105, 140 | 70, 80, 90, 100 |
| 40 | 40 | 35 | 40 | 40 | 80, 100, 120 | 80, 90, 100, 110 |
| 45 | 45 | 40 | 45 | 45 | 90, 135 | 90, 100, 110, 120 |
| 50 | 50 | 45 | 50 | 50 | 100, 125, 150 | 100, 110, 120, 130 |
Since I selected \(D_k = 35\) mm, I used the corresponding group. Because of the distance limits imposed by the inner gates, I set the minimum \(L\) to 105 mm and selected \(D = 70\) mm. This gave a compact but sufficiently strong sprue cup and runner arrangement for the precision casting tree. The initial module assembly therefore used a single transverse runner with two inner gates and a central sprue cup.
After the initial gating layout was established, I performed casting simulation. A typical casting CAE workflow includes a pre-processing module, a calculation and analysis module, and a post-processing module. In pre-processing, I created the mesh for the three-dimensional model. In the calculation module, I solved the physical fields of the mold assembly. In post-processing, I converted the results into images and animations so that filling and solidification behavior could be interpreted clearly. A full simulation normally includes filling analysis and solidification analysis. Filling analysis reveals how the liquid metal flows and helps identify cold shuts, misruns, gas holes, and related defects. Solidification analysis reveals the transformation from liquid to solid and shows isolated liquid regions, shrinkage porosity, and shrinkage cavity distribution. In this work, I focused on solidification analysis because the main question was whether the calculated gating dimensions provided sufficient feeding.
The initial solidification simulation showed that the overall shrinkage tendency of the casting was small. However, the simulation also indicated extremely small shrinkage porosity near the inner gate locations. When I compared the solidification sequence, I observed that the inner gate solidified before the hot spot. This created an obvious flow cut-off. Once the gate channel was blocked, the hot spot could not receive enough liquid feeding. Based on prior experience, I predicted that the actual casting would show a certain proportion of shrinkage porosity and shrinkage looseness at the hot spot after gate cut-off. This would affect subsequent machining holes and could cause rejection. The initial gating system therefore required optimization.
The gate cut-off indicated that the feeding channel was insufficient. The feeding channel is influenced not only by the neck cross-sectional area but also by heat dissipation at the inner gate. For the same neck cross-section, a gate that cools more slowly remains open longer and feeds more effectively. Heat dissipation from the inner gate depends on the neck section size and shape, the gate shape, the gate height, and the weld surface area between the gate and the casting. In the initial simulation, the gate was almost fully solidified when cut-off occurred. Instead of immediately increasing the neck cross-section, I considered increasing the gate volume and weld surface area and reducing the effective gate height to lower heat loss. This approach can strengthen feeding and also reduce the risk of wax pattern breakage during shell making when the neck section is small.
If I increased the inner gate dimensions, the weld surface on the transverse runner became insufficient, so the runner also had to be enlarged. Before optimization, the inner gate height was 15 mm. Directly reducing the height would affect sand filling at the inner gate. I therefore introduced an angled weld surface. With this design, the bottom gap of the module became smaller, and the gap could be filled during shell making to increase the overall shell strength. The module was placed horizontally during knock-off, and the sprue cup was inclined relative to the horizontal plane, which made knock-off easier and more labor-efficient.
I also optimized the runner and sprue cup arrangement. The simulation showed that the liquid metal in the sprue cup was fully sufficient for feeding. The runner feeding path was smooth, and there was excess liquid metal in the section between the two inner gates. I therefore removed the middle portion of the transverse runner. This reduced runner weight and improved process yield. As the inner gate weld surface increased, the runner weld surface also increased, while the runner thickness remained unchanged. To improve the strength of the runner module and shell, I added a thread structure at the connection between the sprue cup and the runner. The sprue cup and runner were connected by a web. The optimized tree was more compact, stronger, and better suited to hammer knock-off.
The most important optimization was the inner gate weld area. Before optimization, the weld surface area was 1,950 mm². Through CAE analysis, I found that when the weld surface area was increased to 2,850 mm², the inner gate no longer showed flow cut-off, and the shrinkage tendency disappeared. The area increase can be expressed as follows:
$$A_{w,0} = 1,950 \ \text{mm}^2$$
$$A_{w,1} = 2,850 \ \text{mm}^2$$
$$\Delta A_w = \frac{A_{w,1} – A_{w,0}}{A_{w,0}} \times 100\% = \frac{2,850 – 1,950}{1,950} \times 100\% = 46.15\%$$
This increase in weld area reduced heat loss from the inner gate and kept the feeding channel open longer. The optimized solidification simulation showed no gate cut-off and no significant shrinkage pores. The optimized process therefore combined two goals: sufficient feeding of the hot spot and reliable fracture at the inner gate neck during hammer knock-off. The main comparison between the initial and optimized designs is summarized below.
| Process feature | Initial design | Optimized design |
|---|---|---|
| Gating type | Single transverse runner and inner gate | Single transverse runner and inner gate with compact runner |
| Inner gate section | 22 mm × 20 mm | 22 mm × 20 mm with enlarged weld surface |
| Inner gate weld area | 1,950 mm² | 2,850 mm² |
| Inner gate height | 15 mm | Reduced effective heat-loss height by angled weld face |
| Neck design | Sharp neck, 75° | Sharp neck, 75°, with 1.5 mm root allowance |
| Runner equivalent diameter | 35 mm | 35 mm, middle section removed |
| Sprue cup | Selected from standard table | Selected with threaded connection and web |
| Simulated gate cut-off | Present | Eliminated |
| Simulated shrinkage tendency | Small but present at gate | Eliminated |
I then moved to physical validation. The first trial batch contained 100 pieces. During shell making, no wax pattern dropped from the tree. After pouring, I knocked the sprue rod by hammer. The blank separated easily from the inner gate neck. The fracture surface was flat and showed no obvious sharp corners. I then examined the blanks by X-ray non-destructive inspection. The hot spots showed no internal defects. There was slight shrinkage looseness at a local corner, which was consistent with the simulation prediction. I machined 95 pieces, and the high-precision holes showed no shrinkage cavity or shrinkage porosity defects. The trial results are summarized below.
| Validation item | Result |
|---|---|
| Trial batch size | 100 pieces |
| Wax pattern drop during shell making | None |
| Hammer knock-off at inner gate neck | Easy and reliable |
| Fracture surface condition | Flat, no obvious sharp corners |
| X-ray inspection at hot spot | No internal defects |
| Local corner condition | Slight shrinkage looseness, consistent with simulation |
| Machined quantity | 95 pieces |
| High-precision hole quality | No shrinkage cavity or shrinkage porosity |
The production effect was also compared with similar castings produced by a comparable route. The shift output for knock-off and cleaning increased from 260 pieces to 600 pieces. The process yield increased from 55% to 68%. I calculated the improvements as follows:
$$P_{improve} = \frac{600 – 260}{260} \times 100\% = 130.77\%$$
$$Y_{improve} = \frac{68 – 55}{55} \times 100\% = 23.64\%$$
These results confirmed that the optimized precision casting process delivered a substantial improvement in both productivity and material utilization. The comparison is shown in the following table.
| Production index | Similar casting | This product | Improvement |
|---|---|---|---|
| Knock-off and cleaning shift output (pieces) | 260 | 600 | 130.77% |
| Process yield (%) | 55 | 68 | 23.64% |
I also reviewed the thermal and geometric basis of the optimized design. During solidification, the time required for a section to solidify can be approximated by the Chvorinov relationship:
$$t_s = C_m \left(\frac{V}{A}\right)^n$$
In this expression, \(t_s\) is solidification time, \(V\) is volume, \(A\) is heat-transfer surface area, \(C_m\) is a mold constant, and \(n\) is an exponent usually close to 2. The modulus \(M\) of a section is:
$$M = \frac{V}{A}$$
A section with a larger modulus cools more slowly. For feeding to remain effective, the feeding channel must remain open longer than the hot spot it feeds. In my initial design, the inner gate cooled too quickly relative to the hot spot, so the channel closed before feeding was complete. By increasing the weld area and gate volume, I reduced the heat-transfer surface area relative to volume and slowed gate cooling. This increased the effective feeding time of the inner gate. I also used the Niyama criterion as a qualitative indicator of shrinkage porosity risk:
$$N = \frac{G}{\sqrt{\dot{T}}}$$
Here, \(G\) is the temperature gradient and \(\dot{T}\) is the cooling rate. Regions with low \(N\) values are more likely to form shrinkage porosity. The optimized simulation reduced the low-\(N\) region at the hot spot. I also considered heat loss from the gate surface using a simplified relation:
$$Q = h A_s (T – T_s) \Delta t$$
In this equation, \(Q\) is heat loss, \(h\) is the heat-transfer coefficient, \(A_s\) is the exposed surface area, \(T\) is the local metal temperature, \(T_s\) is the surrounding temperature, and \(\Delta t\) is the time interval. By increasing the weld surface area and modifying the gate geometry, I effectively changed the local heat balance so that the gate remained liquid longer and continued to feed the hot spot.
The ratio of weld area to neck area was also useful during optimization. I defined a simple geometric index:
$$R = \frac{A_w}{A_n}$$
where \(A_w\) is the weld surface area and \(A_n\) is the neck cross-sectional area. In the initial design, \(R\) was relatively low, which limited the volume of metal available near the neck and increased the influence of heat loss. In the optimized design, \(A_w\) increased while the neck remained small enough to fracture by hammer. This balance was central to the success of the precision casting process. The neck had to be weak enough to break under impact, but the surrounding gate body had to be large enough to remain liquid and feed the casting.
The optimized gating dimensions and process settings are summarized below. I have expressed the values in a form that can be reused for similar low-carbon steel precision casting parts.
| Parameter | Symbol | Value or condition |
|---|---|---|
| Casting material | — | Low-carbon alloy steel |
| Carbon content | — | 0.18–0.22% |
| Yield strength | — | 240 MPa |
| Tensile strength | — | 450–700 MPa |
| Elongation | — | 22% |
| Casting structure | — | Hollow side-enclosing thin wall |
| Gating system | — | Single transverse runner and inner gate |
| Hot spot section | \(a \times b\) | Approximately 15 mm × 75 mm |
| Feeding zone mass per gate | \(G\) | 600 g |
| Casting hot spot equivalent diameter | \(D_c\) | 23 mm |
| Weight factor | \(k\) | 0.93 |
| Theoretical gate diameter | \(D_g\) | 21.39 mm |
| Selected gate section | — | 22 mm × 20 mm |
| Runner equivalent diameter | \(D_k\) | 35 mm |
| Runner condition | — | \(D_k \ge (1.15 \sim 1.25)D_g\) |
| Sprue cup length | \(L\) | 105 mm minimum |
| Sprue cup diameter | \(D\) | 70 mm |
| Initial weld surface area | \(A_{w,0}\) | 1,950 mm² |
| Optimized weld surface area | \(A_{w,1}\) | 2,850 mm² |
| Weld area increase | \(\Delta A_w\) | 46.15% |
| Neck angle | — | 75° |
| Root allowance | — | 1.5 mm |
| Simulation result after optimization | — | No cut-off, no significant shrinkage |
I also prepared a risk matrix during the optimization. The matrix helped me compare the initial and optimized designs in terms of feeding, knock-off, shell strength, and production cost. The most important insight was that a small neck does not by itself guarantee good hammer knock-off if the gate has already solidified and the casting is not fed. The neck must be integrated with a gate body that remains liquid long enough. In other words, the design must separate the mechanical fracture function from the thermal feeding function. The neck controls fracture; the gate volume and weld surface control feeding.
| Risk factor | Initial design | Optimized design | Effect of optimization |
|---|---|---|---|
| Gate cut-off before hot spot solidification | High | Low | Weld area and gate volume increased |
| Shrinkage porosity at hot spot | Moderate | Low | Feeding path remained open |
| Hammer knock-off difficulty | Moderate | Low | Sharp neck and 75° angle |
| Casting body missing material | Moderate | Low | 1.5 mm root allowance |
| Wax pattern breakage during shell making | Moderate | Low | Gate volume increased |
| Shell strength at module bottom | Moderate | Improved | Angled weld face and filled gap |
| Runner weight | Higher | Lower | Middle runner section removed |
| Process yield | 55% for similar parts | 68% | 23.64% improvement |
| Knock-off and cleaning output | 260 pieces per shift for similar parts | 600 pieces per shift | 130.77% improvement |
I further evaluated the gate design using the concept of a feeding channel resistance ratio. A simplified form can be written as:
$$K_f = \frac{A_g}{L_g}$$
where \(A_g\) is the gate cross-sectional area and \(L_g\) is the gate length. A larger \(K_f\) indicates a lower resistance to liquid feeding. In this precision casting application, the gate length was constrained by the casting geometry, so I could not increase \(K_f\) by shortening the gate indefinitely. Instead, I increased the effective liquid volume around the neck and improved the thermal mass of the gate. This was achieved by increasing the weld surface area from 1,950 mm² to 2,850 mm² and by using an angled weld surface. The result was a gate that stayed open longer without requiring an excessively large neck.
The sprue cup also played an important role. The sprue cup is the main liquid reservoir in the sprue cup feeding capacity method. I checked that the sprue cup volume was sufficient for the total feeding demand. A simple feeding volume check can be expressed as:
$$V_{cup} \ge V_{feed} + V_{loss}$$
Here, \(V_{cup}\) is the usable sprue cup volume, \(V_{feed}\) is the volume required by the hot spots, and \(V_{loss}\) is the volume lost to oxidation, shell reaction, and incomplete drainage. In the initial simulation, the sprue cup volume was more than sufficient. The main problem was not the total liquid volume but the timing of solidification in the gate. This is why I did not increase the sprue cup size. Instead, I focused on the inner gate and runner geometry. This decision kept the tree compact and helped improve process yield.
The optimized simulation was performed after the gating and module changes. The results showed no cut-off at the inner gate. The hot spot received liquid feeding throughout the final stages of solidification. The shrinkage tendency that had appeared in the initial simulation was eliminated. The predicted defect distribution matched the physical trial results. X-ray inspection showed no internal defects at the hot spots, and machining of 95 pieces confirmed that the high-precision holes were free from shrinkage cavity and shrinkage porosity. The slight corner looseness observed in the trial was also predicted by simulation and was acceptable for the part.
From a production standpoint, the optimized precision casting process reduced dependence on flame cutting. Flame cutting had been costly and inefficient for the previous low-carbon, high-toughness material. With the new gate design, the operator could knock off the casting by hammer at the neck. The fracture surface was flat and did not require excessive grinding. This reduced labor, consumable cost, and cycle time. It also reduced the risk of impact damage to the casting because fewer hammer strikes were needed. The shift output for knock-off and cleaning rose to 600 pieces, and the process yield rose to 68%. These values represent a clear improvement over the similar casting benchmark.
I also considered the influence of shell strength. In precision casting, the shell must support the wax pattern and the molten metal. A weak shell can crack or deform during pouring. The optimized module used a smaller bottom gap and an angled weld face. During shell making, the gap could be filled with slurry and stucco, which increased local shell thickness and strength. The threaded connection between the sprue cup and runner also improved handling strength. These changes were important because the optimized inner gate had a larger volume and weld surface, which increased the load on the shell. The physical trial confirmed that the shell was robust: no wax pattern dropped during shell making, and no shell-related defects were observed after pouring.
I summarized the final process logic as follows. First, I calculated the inner gate diameter using the sprue cup feeding capacity method. Second, I selected a practical rectangular gate section because the theoretical round gate did not fit the casting structure. Third, I designed a sharp neck with a 75° angle and a 1.5 mm root allowance to promote hammer knock-off. Fourth, I sized the runner with the condition \(D_k \ge (1.15 \sim 1.25)D_g\) and selected \(D_k = 35\) mm. Fifth, I selected the sprue cup dimensions from the standard table and set \(L\) to at least 105 mm and \(D\) to 70 mm. Sixth, I simulated solidification and found gate cut-off. Seventh, I increased the gate volume and weld surface area and reduced heat loss. Eighth, I removed the middle runner section to improve yield. Ninth, I validated the optimized design by simulation, X-ray inspection, machining, and production trials.
The final optimized gating design can be described by the following set of equations and conditions:
$$D_g = k D_c$$
$$D_c = 23 \ \text{mm}$$
$$k = 0.93$$
$$D_g = 0.93 \times 23 = 21.39 \ \text{mm}$$
$$A_g = 22 \times 20 = 440 \ \text{mm}^2$$
$$D_k \ge (1.15 \sim 1.25)D_g$$
$$D_k = 35 \ \text{mm}$$
$$L \ge 105 \ \text{mm}$$
$$D = 70 \ \text{mm}$$
$$A_{w,0} = 1,950 \ \text{mm}^2$$
$$A_{w,1} = 2,850 \ \text{mm}^2$$
$$\Delta A_w = 46.15\%$$
$$\eta_{initial} = 55\% \ \text{for similar parts}$$
$$\eta_{optimized} = 68\%$$
$$P_{improve} = 130.77\%$$
$$Y_{improve} = 23.64\%$$
These values formed the basis for the final precision casting work instruction. I also recorded the key inspection points: inner gate neck angle, root allowance, weld surface area, runner equivalent diameter, sprue cup length and diameter, shell filling at the angled weld face, and knock-off fracture surface quality. The inspection plan helped ensure that the optimized design was reproduced consistently in production. Because the material is low-carbon and high-toughness, the neck design and gate thermal mass were especially important. A gate that is too small will not feed; a gate that is too large will be difficult to knock off and will reduce yield. The optimized design balanced these competing requirements.
I also noted that theoretical calculation alone was not sufficient. The sprue cup feeding capacity method provided a useful starting point, but the actual casting structure, local heat transfer, shell geometry, and runner layout introduced deviations. CAE simulation was essential because it revealed the gate cut-off and showed where feeding was insufficient. By using simulation before cutting tooling, I avoided a costly trial-and-error cycle. The simulation also helped me quantify the effect of increasing the weld surface area. When the weld area reached 2,850 mm², the cut-off disappeared. This gave me a clear process window for production. I could then design the neck for hammer knock-off without compromising feeding.
The successful trial also showed that the optimized precision casting process was robust. The first 100 pieces had no wax pattern drop during shell making. The hammer knock-off step was easy. The fracture surface was flat and clean. X-ray inspection showed no internal defects at the hot spots. Machining of 95 pieces confirmed that the high-precision holes were free from shrinkage defects. These results were consistent with the simulation. The production comparison showed a 130.77% increase in knock-off and cleaning shift output and a 23.64% increase in process yield. This confirmed that the optimization reduced cost, improved efficiency, and maintained casting quality.
In conclusion, I found that precision casting of a low-carbon steel forklift head requires careful attention to the conflict between feeding and knock-off. The material has high toughness, so the gate neck must be designed to create stress concentration and fracture cleanly. At the same time, the gate must remain liquid long enough to feed the hot spot. When the neck cross-section is too small and the feeding channel is insufficient, increasing the gate volume and weld surface area can reduce heat loss and improve feeding. An angled weld surface can reduce the effective heat-loss height without causing sand-filling problems. A threaded connection and web can improve module strength. Removing the middle runner section can improve process yield. CAE simulation is a powerful tool for verifying these changes and for identifying the cause of defects. The optimized precision casting process achieved reliable hammer knock-off, eliminated significant shrinkage, improved process yield to 68%, and increased knock-off and cleaning output to 600 pieces per shift. I consider this approach suitable for similar low-carbon, high-toughness precision casting parts where flame cutting would otherwise be required.