
In our foundry, the A16 wheel hub is a ductile iron component used in the transmission systems of agricultural machinery and industrial machinery, especially in crawler-type combined wheels. The casting weighs 64 kg and is made from QT450-10 ductile iron. Its maximum outline dimensions range from about ϕ322 mm to ϕ285 mm. The component is divided into an external traveling section and an internal connecting section, and the two sections are joined by ribs. The wall thickness is relatively thin in the ribbed regions, while the top and side regions are much thicker. Because the hub operates under mechanical loading and must satisfy both internal quality and external appearance requirements, we treat dimensional accuracy, shrinkage soundness, nodularity, and graphite morphology as critical quality characteristics. Our production route is lost foam casting, and the process has demonstrated strong potential for near-net-shape manufacturing. However, lost foam casting of ductile iron also introduces specific risks related to pattern pyrolysis, carbon pickup, reduced cooling rate, and local variation in solidification behavior. These risks became especially clear during our initial production of the A16 wheel hub.
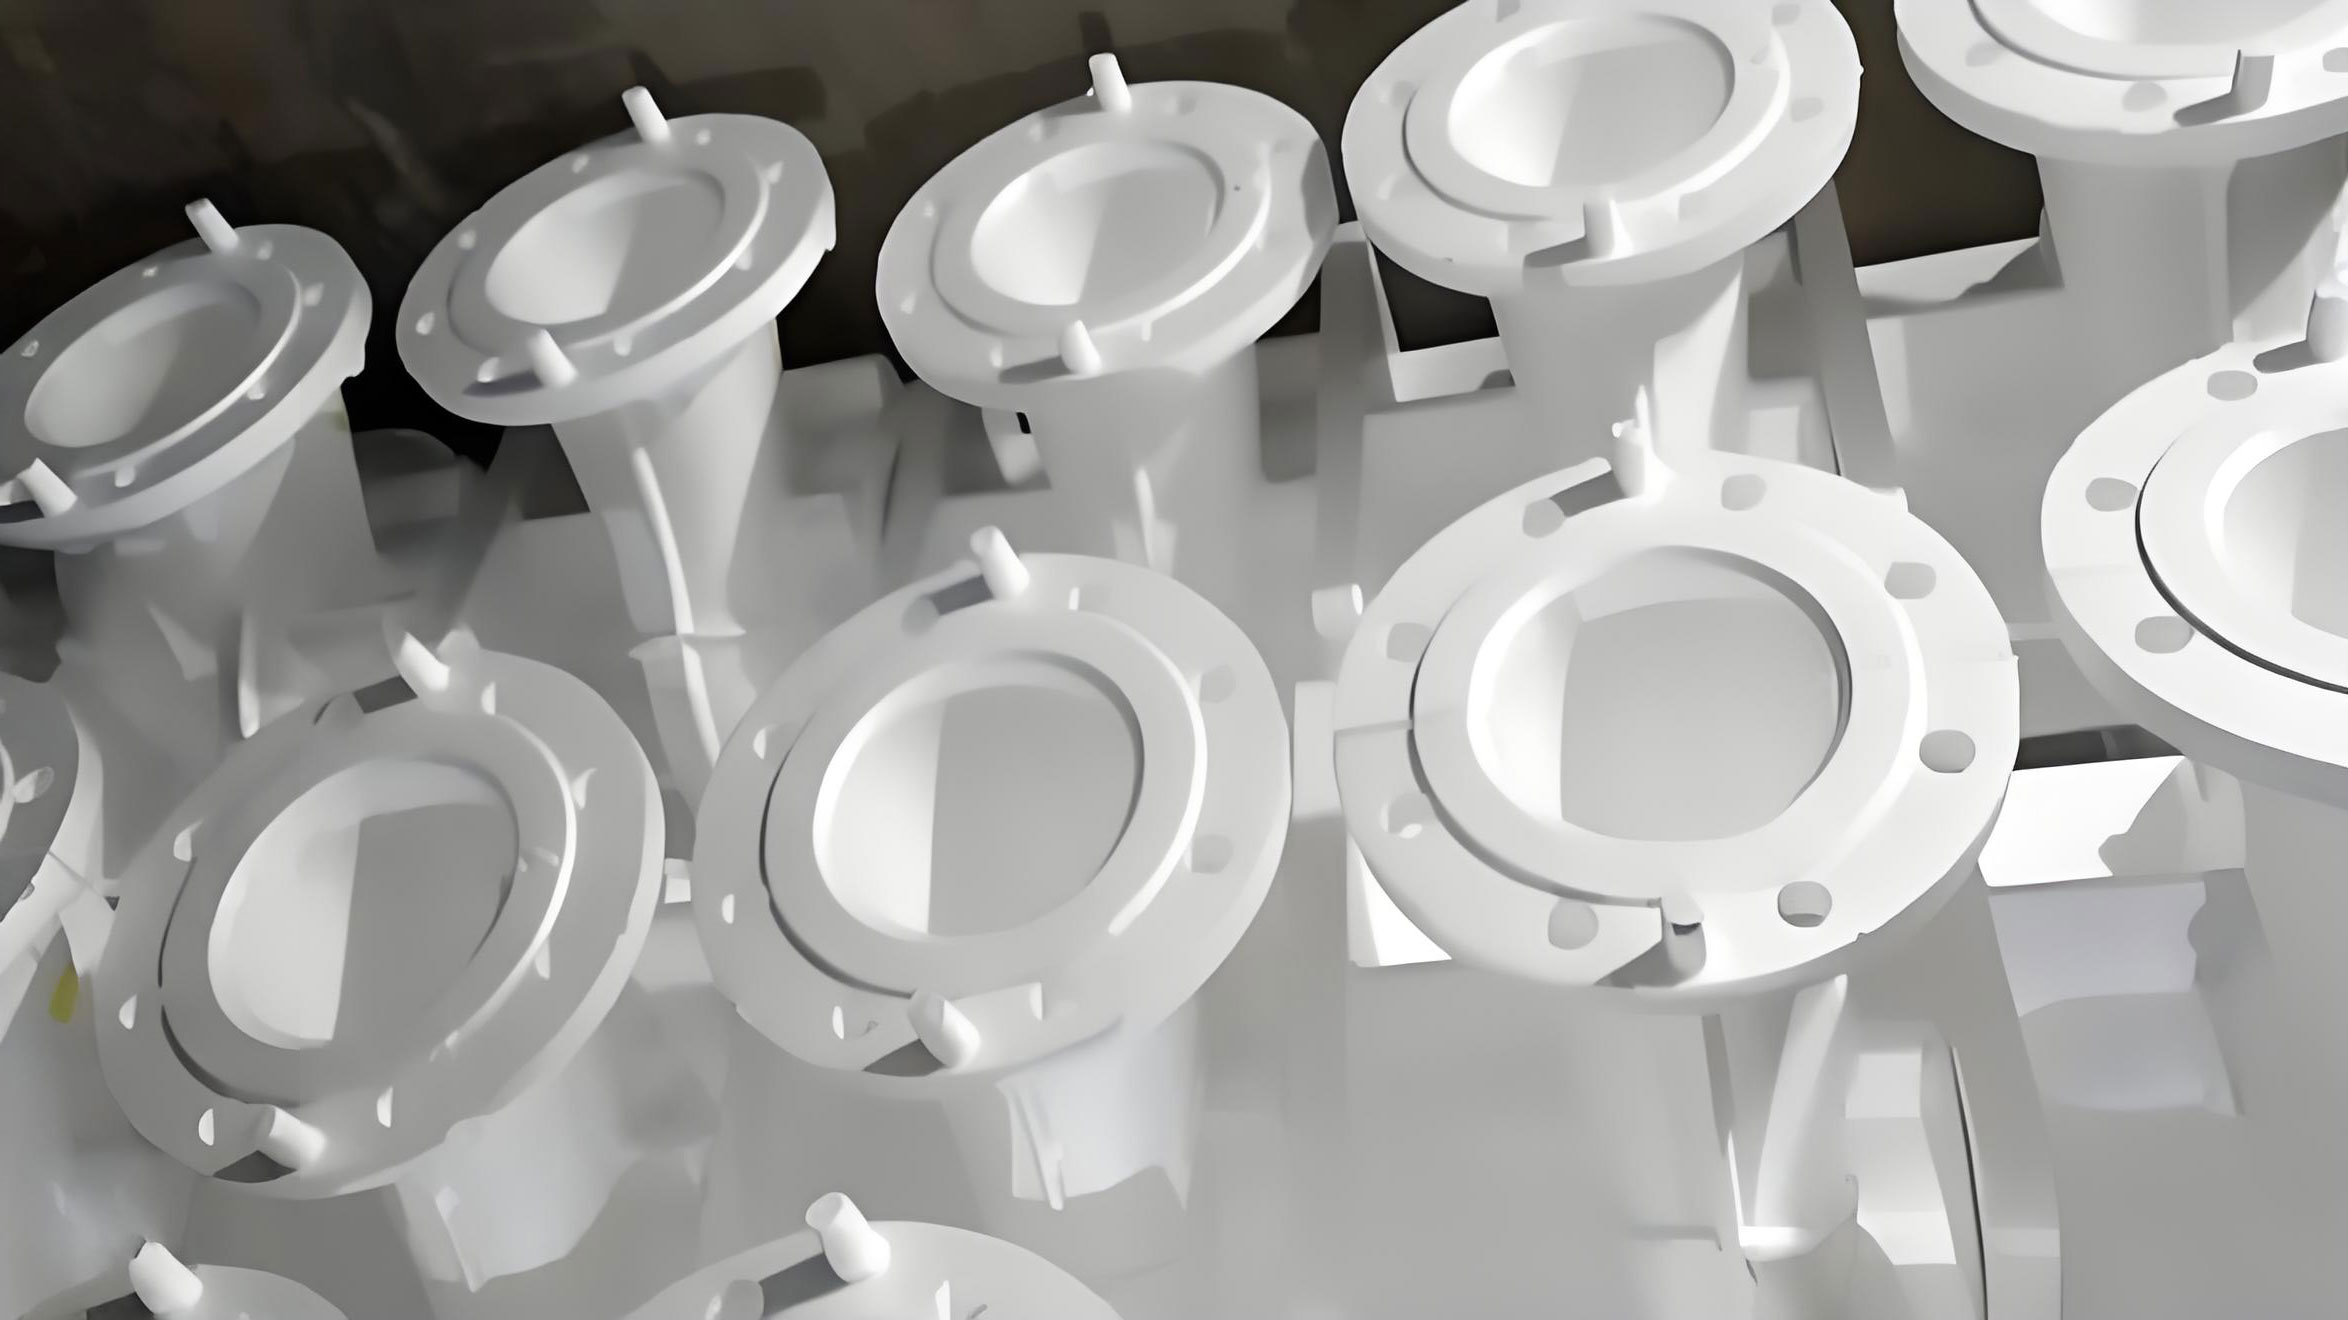
In our early production campaign, we used a medium-frequency induction furnace for melting. The gating system was a top-pouring arrangement. The initial process window was set as follows: tapping temperature of 1520–1540 °C, pouring temperature of 1440–1480 °C, pouring vacuum of -0.065 to -0.075 MPa, and holding time after pouring of 4–5 min. Over a six-month statistical period, we produced 2100 wheel hub castings and evaluated them from three perspectives: dimensions, surface quality, and metallography. The dimensional results were acceptable. However, the rejection rate caused by shrinkage cavities and shrinkage porosity was 7.95%, and the rejection rate caused by unacceptable metallography was 5.38%. The metallographic failures were mainly related to poor nodularization caused by graphite flotation. The total reject rate was therefore too high for stable serial production. We decided to investigate the two dominant defect families in detail and to build a systematic control plan for lost foam casting of this ductile iron hub.
Baseline Product and Process Definition
We first established a baseline definition of the product, the material, and the lost foam casting process. The purpose was to separate normal process variation from true defect mechanisms. The A16 wheel hub has a geometry that is not uniform in thermal mass. The external traveling portion is relatively thin in some regions, while the internal connecting portion and the top and side areas contain thicker sections. This thermal mass distribution is important because the local cooling modulus controls the local solidification time in lost foam casting. The local cooling modulus can be described by the volume-to-surface-area ratio:
$$M = \frac{V}{A}$$
where \(M\) is the cooling modulus, \(V\) is the local volume, and \(A\) is the local heat-transfer surface area. According to Chvorinov’s rule, the local solidification time can be approximated as:
$$t_s = B M^2 = B \left(\frac{V}{A}\right)^2$$
where \(t_s\) is the solidification time and \(B\) is a mold constant that depends on the mold material, the pattern decomposition behavior, the vacuum level, and the initial temperature. In lost foam casting, the mold constant is not a fixed value. The pattern decomposition absorbs heat, the vacuum level changes the effective heat transfer, and the decomposition products can alter the local atmosphere. As a result, the thick sections of the A16 wheel hub remain liquid longer than the thin sections.
| Item | Baseline value or description |
|---|---|
| Product | A16 wheel hub for crawler-type combined wheels |
| Application | Agricultural machinery and industrial machinery transmission systems |
| Material | QT450-10 ductile iron |
| Casting weight | 64 kg |
| Maximum outline size | ϕ322 mm to ϕ285 mm |
| Structure | External traveling portion and internal connecting portion joined by ribs |
| Wall thickness condition | Thin ribbed walls, thicker top and side regions |
| Melting equipment | Medium-frequency induction furnace |
| Gating system | Top-pouring system |
| Lost foam pattern material | STMMA copolymer with carbon content of approximately 69.6% |
| Tapping temperature | 1520–1540 °C |
| Pouring temperature | 1440–1480 °C |
| Pouring vacuum | -0.065 to -0.075 MPa |
| Holding time after pouring | 4–5 min |
| Production quantity in statistical period | 2100 pieces |
| Dimensional result | Qualified |
| Shrinkage reject rate | 7.95% |
| Metallurgical reject rate | 5.38% |
| Main metallurgical failure mode | Poor nodularization caused by graphite flotation |
The baseline chemical composition range for QT450-10 is summarized below. We use mass fractions throughout this discussion. The carbon and silicon levels determine the carbon equivalent, which in turn affects graphite formation, fluidity, shrinkage behavior, and the tendency for graphite flotation. The magnesium and rare earth contents determine nodularization, but excessive residual magnesium can increase shrinkage tendency.
| Element | Baseline range, wt.% | Role in lost foam casting ductile iron |
|---|---|---|
| C | 3.65–3.85 | Controls carbon equivalent, graphite volume, fluidity, and expansion during solidification |
| Si | 2.65–2.85 | Promotes graphitization, increases carbon equivalent, and influences graphite flotation |
| Mn | 0.2–0.6 | Controls matrix strength and hardenability; excessive levels can promote carbides |
| P | ≤0.07 | Can form phosphide networks and lower toughness |
| S | ≤0.02 | Consumes nodulizing elements and affects nodule count |
| Mg | 0.03–0.065 | Essential for nodularization, but high residual magnesium increases shrinkage tendency |
| RE | 0.02–0.04 | Aids nodularization and controls sulfur and oxygen, but excess can affect graphite morphology |
The carbon equivalent was calculated by the following expression:
$$CE = w_C + \frac{w_{Si}}{3} + \frac{w_P}{3}$$
For ductile iron, the silicon contribution is especially important because silicon strongly promotes graphitization. In our initial production, the carbon equivalent was deliberately held at a high level, between 4.65% and 4.80%, in order to improve fluidity and reduce shrinkage cavities. This decision later proved to be one of the main reasons for graphite flotation. The high carbon equivalent increased the amount of graphite that could form and float in the slowly cooled thick sections of the lost foam casting.
Shrinkage Defects in Lost Foam Casting
The first major defect was shrinkage, including both visible shrinkage cavities and dispersed shrinkage porosity. In our initial lost foam casting process, we used a sandwich spheroidizing treatment. In this method, the nodulizer is placed in the bottom of the ladle and covered with iron chips or other material. The molten iron is then poured into the ladle so that the nodulizer dissolves and reacts with the iron. The method is simple and widely used, but the recovery of magnesium is variable. To avoid poor nodularization, we increased the nodulizer addition. This increased the residual magnesium content to a high range of 0.045–0.065%. The result was a high shrinkage reject rate.
The interaction between nodulizer addition, residual magnesium, and shrinkage can be expressed in a simplified mass balance. The required nodulizer mass can be estimated as:
$$m_{nod} = \frac{m_{iron} \left([Mg]_{target} – [Mg]_0\right)}{[Mg]_{nod} \eta_{Mg}}$$
where \(m_{nod}\) is the nodulizer mass, \(m_{iron}\) is the iron mass, \([Mg]_{target}\) is the desired residual magnesium, \([Mg]_0\) is the initial magnesium in the iron, \([Mg]_{nod}\) is the magnesium content of the nodulizer, and \(\eta_{Mg}\) is the magnesium recovery. If the recovery \(\eta_{Mg}\) is low or inconsistent, operators tend to increase \(m_{nod}\). The residual magnesium then becomes:
$$[Mg]_{res} = [Mg]_0 + \frac{m_{nod} [Mg]_{nod} \eta_{Mg}}{m_{iron}} – [Mg]_{loss}$$
where \([Mg]_{loss}\) represents magnesium consumed by sulfur, oxygen, and other reactions. When \([Mg]_{res}\) is high, the iron has a stronger tendency to form carbides and to solidify with a larger contraction. The total solidification contraction can be described as a sum of contributions:
$$\epsilon_{total} = \epsilon_L + \epsilon_{\gamma} + \epsilon_{carbide} – \epsilon_{graphite}$$
where \(\epsilon_L\) is liquid contraction, \(\epsilon_{\gamma}\) is austenite contraction, \(\epsilon_{carbide}\) is carbide eutectic contraction, and \(\epsilon_{graphite}\) is graphite expansion. Graphite expansion partially compensates for the contraction of the metallic matrix. If graphite nucleation is suppressed, the graphite expansion term decreases. At the same time, carbide eutectic formation increases the contraction term. Therefore, high residual magnesium indirectly increases the net shrinkage.
We confirmed this effect by comparing two production heats. Each heat contained four ladles, and each ladle contained five castings, giving 40 castings in total. All castings were surface machined, and samples were sectioned for internal examination. The first heat used a nodulizer addition of 1.76%. The second heat used a nodulizer addition of 1.18%. The residual magnesium and shrinkage reject rates differed significantly.
| Heat | Ladle | C, wt.% | Si, wt.% | Mn, wt.% | P, wt.% | S, wt.% | Mg, wt.% | RE, wt.% | Nodulizer addition, wt.% | Shrinkage reject rate, % |
|---|---|---|---|---|---|---|---|---|---|---|
| Heat 1 | 1 | 3.74 | 2.85 | 0.45 | 0.035 | 0.018 | 0.060 | 0.030 | 1.76 | 8.0 |
| Heat 1 | 2 | 3.76 | 2.80 | 0.46 | 0.036 | 0.016 | 0.058 | 0.027 | 1.76 | 8.0 |
| Heat 1 | 3 | 3.76 | 2.79 | 0.48 | 0.040 | 0.016 | 0.058 | 0.024 | 1.76 | 8.0 |
| Heat 1 | 4 | 3.70 | 2.79 | 0.48 | 0.040 | 0.016 | 0.056 | 0.025 | 1.76 | 8.0 |
| Heat 2 | 1 | 3.69 | 2.66 | 0.45 | 0.032 | 0.015 | 0.041 | 0.021 | 1.18 | 3.0 |
| Heat 2 | 2 | 3.72 | 2.66 | 0.46 | 0.035 | 0.018 | 0.041 | 0.019 | 1.18 | 3.0 |
| Heat 2 | 3 | 3.67 | 2.63 | 0.46 | 0.036 | 0.017 | 0.039 | 0.021 | 1.18 | 3.0 |
| Heat 2 | 4 | 3.66 | 2.63 | 0.46 | 0.033 | 0.018 | 0.039 | 0.020 | 1.18 | 3.0 |
The comparison showed that when the nodulizer addition was reduced from 1.76% to 1.18%, the residual magnesium decreased from approximately 0.056–0.060% to approximately 0.039–0.041%. At the same time, the shrinkage reject rate decreased from 8.0% to 3.0%. This was strong evidence that excessive residual magnesium was a primary cause of shrinkage in our lost foam casting process.
The mechanism can be understood through nucleation and growth. Magnesium is a strong carbide-forming element under certain conditions. It reacts with sulfur and oxygen and reduces the availability of elements that can act as graphite nucleation substrates. As a result, the eutectic undercooling increases:
$$\Delta T = T_{eq} – T_{actual}$$
where \(T_{eq}\) is the equilibrium eutectic temperature and \(T_{actual}\) is the actual solidification temperature. A larger \(\Delta T\) promotes carbide eutectic formation. Carbide eutectic has a larger contraction than graphite eutectic, so the net volume shrinkage increases. In addition, high residual magnesium promotes the precipitation of primary austenite at a higher temperature. The primary austenite then grows into coarse dendrites over a wider temperature range. These dendrites form a network that hinders the feeding of liquid iron into the shrinking regions. Magnesium-containing inclusions also concentrate in the remaining liquid and create favorable sites for shrinkage porosity. The combination of reduced graphite expansion, increased carbide contraction, coarse dendrite formation, and blocked feeding channels explains why high residual magnesium increased the shrinkage reject rate in lost foam casting.
Graphite Flotation in Lost Foam Casting
The second major defect was graphite flotation. Graphite flotation is a density segregation phenomenon specific to ductile iron. It occurs when graphite nodules or graphite clusters form and float upward through the liquid iron before the casting has solidified. Because graphite has a density of about 2.2 g/cm³ and liquid iron has a density of about 7.0 g/cm³, the buoyancy force on graphite is significant. In thick sections, the solidification time is long, so graphite has enough time to move. The result is an accumulation of graphite near the upper surface of the casting. In severe cases, the accumulated graphite appears as dark gray areas on the casting surface or on machined surfaces. These areas have poor mechanical properties and often show exploded graphite under the microscope.
The upward velocity of a graphite particle can be approximated by Stokes’ law:
$$v_s = \frac{2 r_g^2 (\rho_l – \rho_g) g}{9 \mu_l}$$
where \(v_s\) is the settling or flotation velocity, \(r_g\) is the effective graphite particle radius, \(\rho_l\) is the liquid iron density, \(\rho_g\) is the graphite density, \(g\) is gravitational acceleration, and \(\mu_l\) is the liquid viscosity. The flotation distance before solidification is:
$$h_f = v_s t_l$$
where \(t_l\) is the time during which the local iron remains liquid. If \(h_f\) is comparable to or larger than the local section thickness, graphite flotation can become visible. This is why graphite flotation is more likely in thick sections and in castings with a high carbon equivalent.
In our A16 wheel hub, several factors combined to increase graphite flotation risk in lost foam casting:
| Factor | Effect on graphite flotation | Observed condition in our baseline process |
|---|---|---|
| Carbon equivalent | High CE increases graphite amount and promotes flotation | Baseline CE was 4.65–4.80% |
| Silicon content | Silicon promotes graphitization and graphite growth | Final Si was often 2.7–2.85% |
| Thick sections | Longer solidification time allows more flotation | Top and side regions were thick |
| Lost foam pattern decomposition | Free carbon from the pattern can be absorbed by liquid iron | STMMA copolymer with about 69.6% carbon |
| Pouring temperature | Higher temperature extends liquid time and lowers viscosity | Baseline pouring was 1440–1480 °C |
| Charge composition | High pig iron and late carburizer addition reduce carbon control | Carburizer was sometimes added after melting |
| Sand temperature and vacuum | They control cooling rate and pattern gas removal | Variation existed in sand temperature and vacuum |
| Holding time | Longer holding keeps the casting hot and delays solidification | Holding was 4–5 min |
| Transfer time | Long transfer causes nodulizing and inoculation fade | Transfer time was not tightly standardized |
The carbon pickup from the lost foam pattern can be estimated as:
$$[C]_{pickup} = \frac{m_p w_C \eta_C}{m_l} \times 100$$
where \([C]_{pickup}\) is the carbon increase in the iron in wt.%, \(m_p\) is the decomposed pattern mass, \(w_C\) is the carbon mass fraction in the pattern, \(\eta_C\) is the fraction of pattern carbon absorbed by the iron, and \(m_l\) is the liquid iron mass. In lost foam casting, the pattern is progressively decomposed as the metal front advances. The decomposition products include hydrocarbons, carbon monoxide, carbon dioxide, hydrogen, and free carbon. Some of the free carbon is absorbed by the liquid iron, especially near the metal front and in regions where the pattern density is high. This increases the local carbon equivalent and promotes graphite flotation.
The gas volume generated by pattern decomposition can be approximated by the ideal gas law:
$$V_g = \frac{m_p R T}{M P}$$
where \(V_g\) is the gas volume, \(R\) is the gas constant, \(T\) is the temperature, \(M\) is the molar mass of the decomposition products, and \(P\) is the pressure. High pattern density or incomplete pattern decomposition increases gas volume. If the vacuum system cannot remove the gas quickly enough, the local pressure increases, the cooling rate changes, and defect formation becomes more likely. Therefore, pattern density control, pattern weight control, vacuum control, and sand temperature control are all part of graphite flotation prevention in lost foam casting.
Our initial carbon equivalent was deliberately high to improve fluidity and reduce shrinkage. However, the same high carbon equivalent promoted graphite flotation in the thick sections. This created a process conflict: reducing carbon equivalent helped graphite flotation but could increase shrinkage; increasing residual magnesium helped nodularization but increased shrinkage. We therefore needed a balanced control strategy rather than a single-variable adjustment.
Root Cause Ranking and Interaction
We ranked the root causes according to their impact and controllability. The ranking helped us decide which variables to adjust first. The main interaction was between residual magnesium and carbon equivalent. High residual magnesium increased shrinkage, while high carbon equivalent increased graphite flotation. If we reduced only carbon equivalent, graphite flotation decreased but shrinkage could increase. If we reduced only residual magnesium, shrinkage decreased but nodularization became less stable. Therefore, we optimized both variables together and tightened the process window.
| Rank | Root cause | Primary defect | Mechanism | Control priority |
|---|---|---|---|---|
| 1 | Excessive nodulizer addition and high residual magnesium | Shrinkage | Carbide eutectic formation, coarse primary austenite, blocked feeding, magnesium inclusion enrichment | Very high |
| 2 | High carbon equivalent | Graphite flotation | Increased graphite volume, higher buoyancy, longer flotation time | Very high |
| 3 | Thick sections and slow cooling | Graphite flotation and shrinkage | Long liquid time and delayed solidification | High |
| 4 | Lost foam pattern carbon pickup | Graphite flotation | Free carbon absorption increases local CE | High |
| 5 | High pouring temperature | Graphite flotation | Longer liquid time and lower viscosity | Medium to high |
| 6 | Carburizer addition practice | Graphite flotation and composition variation | Poor carburizer dissolution and absorption | Medium to high |
| 7 | Sand temperature, vacuum, and holding time | Both defects | Unstable cooling and gas removal | Medium |
| 8 | Transfer and treatment time | Nodularization and inoculation fade | Loss of active magnesium and nuclei | Medium |
The net shrinkage can be expressed as a balance between contraction and expansion:
$$\epsilon_{net} = \epsilon_{liquid} + \epsilon_{austenite} + \epsilon_{carbide} – \epsilon_{graphite} – \epsilon_{feeding}$$
where \(\epsilon_{feeding}\) represents the compensation provided by liquid feeding. High residual magnesium reduces \(\epsilon_{graphite}\) and increases \(\epsilon_{carbide}\). It also reduces \(\epsilon_{feeding}\) by promoting coarse dendrites. High carbon equivalent increases \(\epsilon_{graphite}\), which helps shrinkage, but it also increases graphite flotation risk. The optimum is therefore a narrow window in which graphite expansion is sufficient to offset contraction without causing flotation.
Countermeasures for Shrinkage and Graphite Flotation
Based on the root cause analysis, we implemented a systematic set of countermeasures. The measures covered chemistry, melting, nodulizing, pouring, pattern control, sand control, vacuum control, and operator discipline. We did not rely on a single change. Instead, we treated the lost foam casting process as a coupled system.
Chemical Composition Control
We reduced the nodulizer addition while maintaining acceptable nodularization. The residual magnesium target was revised to 0.035–0.060%. The carbon equivalent was reduced to 4.50–4.70%. The base iron silicon content was controlled to 1.50–1.70%. The final carbon content was controlled to no more than 3.80%, and the final silicon content was controlled to no more than 2.70%. These ranges reduced graphite flotation risk while still providing enough graphite expansion to limit shrinkage.
| Parameter | Baseline | Optimized target | Reason for change |
|---|---|---|---|
| Residual Mg, wt.% | 0.045–0.065 | 0.035–0.060 | Reduce carbide tendency and shrinkage |
| Carbon equivalent, % | 4.65–4.80 | 4.50–4.70 | Reduce graphite flotation |
| Base iron Si, wt.% | Not tightly controlled | 1.50–1.70 | Control graphitization and final Si |
| Final C, wt.% | 3.65–3.85 | ≤3.80 | Limit excess graphite |
| Final Si, wt.% | 2.65–2.85 | ≤2.70 | Limit graphite growth and flotation |
| Nodulizer addition | Up to 1.76% in trial heat | Reduced and controlled | Lower residual Mg and shrinkage |
| RE, wt.% | 0.020–0.040 | 0.020–0.040 | Maintain nodularization without excess |
We also used the carbon equivalent formula to verify each heat before pouring:
$$CE = w_C + \frac{w_{Si}}{3} + \frac{w_P}{3}$$
For example, if \(w_C = 3.75\), \(w_{Si} = 2.65\), and \(w_P = 0.035\), then:
$$CE = 3.75 + \frac{2.65}{3} + \frac{0.035}{3} \approx 4.645$$
This value lies within the optimized window. If the calculated CE exceeded 4.70, we adjusted the charge or the silicon addition before tapping. If the CE was below 4.50, we reviewed the carbon and silicon balance to avoid excessive shrinkage.
Pouring Temperature and Ladle Practice
We reduced the pouring temperature to 1440–1460 °C. We also preheated the ladle and ladle cover by baking and by passing hot iron through the ladle before the production pour. This practice reduced the temperature loss during transfer and reduced the oxidation and burning loss of nodulizer and inoculant. We maintained the iron at 1520–1540 °C for approximately 10 min before tapping to ensure complete melting and homogenization. Immediately before tapping, we lowered the furnace temperature. This improved the stability of the nodulizing reaction and reduced the tendency for excessive magnesium fade.
| Process step | Baseline practice | Optimized practice | Expected effect |
|---|---|---|---|
| Ladle preheating | Limited or inconsistent | Bake and preheat with hot iron | Reduce temperature loss and reaction variation |
| Ladle cover | Not always used effectively | Preheat and use cover | Reduce magnesium loss and oxidation |
| Furnace holding before tapping | Variable | 10 min at 1520–1540 °C | Improve melt homogeneity |
| Tapping temperature | 1520–1540 °C | 1520–1540 °C with controlled lowering before tap | Stabilize nodulizing reaction |
| Pouring temperature | 1440–1480 °C | 1440–1460 °C | Reduce liquid time and graphite flotation |
| Holding time after pouring | 4–5 min | Controlled by section and vacuum | Improve cooling consistency |
Carburizer Addition and Charge Practice
We changed the carburizer addition practice. In the baseline process, carburizer was sometimes added after the iron had already melted. This reduced the dissolution time and absorption efficiency. In the optimized process, carburizer was added in batches before the iron was fully melted. We avoided direct addition of carburizer into the molten iron pool after melting. This improved carbon recovery and reduced local carbon variation. The carbon absorption efficiency can be expressed as:
$$\eta_C = \frac{\Delta C_{actual}}{\Delta C_{theoretical}} \times 100$$
where \(\eta_C\) is the carbon absorption efficiency, \(\Delta C_{actual}\) is the measured carbon increase, and \(\Delta C_{theoretical}\) is the carbon increase expected from the added carburizer. By improving \(\eta_C\), we reduced the need to add excess carburizer, which in turn reduced the risk of high carbon equivalent and graphite flotation.
| Practice | Baseline | Optimized | Benefit |
|---|---|---|---|
| Carburizer addition timing | Sometimes after melting | Before melting, in batches | Higher and more uniform carbon recovery |
| Carbon control | Based mainly on final analysis | Calculated before tap and verified after tap | Reduced CE variation |
| Charge sequence | Variable | Standardized | Stable melting and composition |
| Pig iron proportion | High in some heats | Controlled and balanced | Reduced graphite flotation tendency |
| Inoculation practice | Time not tightly controlled | Standardized delay and addition | Improved nodule count and uniformity |
Lost Foam Pattern and Sand Process Control
The lost foam pattern itself is a source of carbon and gas. We therefore introduced daily pattern weight measurement to ensure pattern density. Higher density means more material to decompose, which increases gas volume and carbon pickup. Lower density can cause pattern collapse or dimensional variation. We controlled the pattern density and weight within a narrow window. We also checked the pattern carbon content and maintained the STMMA copolymer quality. The pattern coating and drying were controlled to reduce moisture and defects.
We tightened sand temperature control, vacuum control, and holding time. Sand temperature affects the cooling rate. If the sand is too hot, the casting cools too slowly, increasing graphite flotation and shrinkage. If the sand is too cold, the cooling rate increases and can cause other defects. The vacuum level affects pattern decomposition product removal and the effective mold strength. We cleaned the vacuum pipes regularly to avoid pressure loss. We also controlled the holding time after pouring so that the casting solidified under stable vacuum without excessive heat retention.
| Control item | Baseline condition | Optimized action | Defect targeted |
|---|---|---|---|
| Pattern weight | Not measured daily | Measured daily and recorded | Graphite flotation and gas defects |
| Pattern density | Variable | Controlled within specification | Carbon pickup and gas volume |
| Pattern carbon content | Not routinely checked | Verified by supplier and incoming inspection | Graphite flotation |
| Sand temperature | Variable | Measured and controlled daily | Cooling rate variation |
| Vacuum negative pressure | Occasional variation | Monitored and recorded | Gas removal and mold stability |
| Vacuum pipe cleanliness | Periodic cleaning | Scheduled cleaning and inspection | Pressure loss and gas defects |
| Holding time | 4–5 min | Controlled by process instruction | Shrinkage and graphite flotation |
| Transfer time | Variable | Shortened and standardized | Nodularization and inoculation fade |
Operator Discipline and Process Standardization
We provided theoretical and practical training to improve operator skill. The training covered nodulizing reaction control, inoculation practice, pouring speed, vacuum operation, pattern handling, and defect recognition. We reduced the time between nodulizing and pouring. Shorter treatment-to-pour time reduces magnesium fade and inoculation fade. We also standardized the sequence of operations and introduced check sheets for critical steps. The human factor is important in lost foam casting because the process window is narrower than in conventional sand casting, especially for ductile iron with thick sections.
| Standardized step | Requirement | Check method | Frequency |
|---|---|---|---|
| Nodulizer weighing | Within ±1% of target | Scale calibration and record | Every ladle |
| Inoculant weighing | Within ±1% of target | Scale calibration and record | Every ladle |
| Ladle preheating | Defined minimum temperature | Thermal indicator or contact thermometer | Every ladle |
| Pouring temperature | 1440–1460 °C | Immersion thermocouple | Every ladle |
| Vacuum level | -0.065 to -0.075 MPa | Vacuum gauge | Continuous |
| Sand temperature | Within specified range | Thermocouple | Every shift |
| Pattern weight | Within specified range | Digital scale | Daily sample |
| Transfer time | As short as practical | Timer and record | Every heat |
Implementation Results
After implementing the countermeasures, we monitored the monthly rejection rates from March through December. The improvements began in August after the revised controls were introduced. The rejection rate caused by poor nodularization decreased continuously. The rejection rate caused by shrinkage also decreased significantly. By November and December, the poor nodularization rejection rate reached zero in the recorded production. The shrinkage rejection rate remained at approximately 2.30–2.48%, which was a major improvement over the baseline level of approximately 8%.
| Month | Poor nodularization rejection, % | Shrinkage rejection, % |
|---|---|---|
| March | 4.00 | 8.27 |
| April | 5.64 | 8.00 |
| May | 5.86 | 7.67 |
| June | 6.48 | 8.93 |
| August | 2.00 | 4.46 |
| September | 1.25 | 3.29 |
| October | 0.35 | 2.88 |
| November | 0 | 2.30 |
| December | 0 | 2.48 |
We calculated the average rejection rates before and after the improvement. For the pre-improvement period from March to June, the average poor nodularization rejection rate was:
$$R_{nod,0} = \frac{4.00 + 5.64 + 5.86 + 6.48}{4} = 5.495\%$$
The average shrinkage rejection rate before improvement was:
$$R_{shr,0} = \frac{8.27 + 8.00 + 7.67 + 8.93}{4} = 8.2175\%$$
For the post-improvement period from August to December, the average poor nodularization rejection rate was:
$$R_{nod,1} = \frac{2.00 + 1.25 + 0.35 + 0 + 0}{5} = 0.72\%$$
The average shrinkage rejection rate after improvement was:
$$R_{shr,1} = \frac{4.46 + 3.29 + 2.88 + 2.30 + 2.48}{5} = 3.082\%$$
The relative reduction in poor nodularization rejection was:
$$\Delta R_{nod} = \frac{R_{nod,0} – R_{nod,1}}{R_{nod,0}} \times 100 = \frac{5.495 – 0.72}{5.495} \times 100 \approx 86.9\%$$
The relative reduction in shrinkage rejection was:
$$\Delta R_{shr} = \frac{R_{shr,0} – R_{shr,1}}{R_{shr,0}} \times 100 = \frac{8.2175 – 3.082}{8.2175} \times 100 \approx 62.5\%$$
These results confirmed that the combined control of residual magnesium, carbon equivalent, pouring temperature, carburizer practice, and lost foam process variables was effective. The improvement was not limited to one defect. Both shrinkage and graphite flotation were reduced at the same time, which indicates that the process window had been moved toward a more stable region.
| Metric | Before improvement | After improvement | Absolute reduction | Relative reduction |
|---|---|---|---|---|
| Average poor nodularization rejection, % | 5.495 | 0.720 | 4.775 | 86.9% |
| Average shrinkage rejection, % | 8.218 | 3.082 | 5.136 | 62.5% |
| Combined defect average, % | 13.713 | 3.802 | 9.911 | 72.3% |
We also tracked process capability for carbon equivalent and residual magnesium. The process capability index can be written as:
$$C_p = \frac{USL – LSL}{6\sigma}$$
where \(USL\) is the upper specification limit, \(LSL\) is the lower specification limit, and \(\sigma\) is the process standard deviation. A higher \(C_p\) indicates a more capable process. After standardization, the carbon equivalent and residual magnesium distributions became narrower. This reduced the frequency of heats that were outside the optimized window and helped stabilize the lost foam casting process.
| Variable | Specification range | Baseline variation | Optimized variation | Effect |
|---|---|---|---|---|
| Residual Mg, wt.% | 0.035–0.060 | Wide and high | Narrower and centered | Less shrinkage |
| Carbon equivalent, % | 4.50–4.70 | 4.65–4.80, often high | Centered near 4.60 | Less graphite flotation |
| Pouring temperature, °C | 1440–1460 | 1440–1480 | Narrower window | More stable cooling |
| Final Si, wt.% | ≤2.70 | Up to 2.85 | Controlled below limit | Less graphite growth |
| Pattern weight | Specified range | Variable | Daily controlled | Less gas and carbon pickup |
Mechanistic Summary
The improved quality resulted from several interacting mechanisms. First, reducing the nodulizer addition lowered residual magnesium. Lower residual magnesium reduced the tendency for carbide eutectic formation and allowed more graphite expansion during solidification. This reduced the net shrinkage. Second, reducing the carbon equivalent lowered the amount of excess graphite in the liquid iron. This reduced the buoyancy-driven flotation of graphite in the thick sections. Third, lowering the pouring temperature reduced the time during which the iron remained fully liquid. This limited both graphite flotation and the time available for shrinkage cavity growth. Fourth, improving carburizer addition increased carbon recovery and reduced local carbon variation. Fifth, better pattern and sand control reduced carbon pickup and gas-related cooling variation in lost foam casting. Sixth, shorter transfer time and better ladle practice reduced magnesium and inoculation fade, which improved nodularity and reduced the need for excess nodulizer.
The following table summarizes the defect mechanisms and the corresponding control actions:
| Defect | Primary mechanism | Key variables | Control action | Result |
|---|---|---|---|---|
| Shrinkage cavity and porosity | High residual Mg, carbide eutectic, coarse dendrites, blocked feeding | Nodulizer addition, residual Mg, CE, pouring temperature, inoculation | Reduce nodulizer, control Mg to 0.035–0.060%, optimize CE, improve inoculation | Shrinkage rejection reduced by about 62.5% |
| Graphite flotation | High CE, slow cooling, free carbon from pattern, long liquid time | CE, Si, thick sections, pouring temperature, pattern carbon, sand temperature | Reduce CE to 4.50–4.70%, limit final Si, lower pouring temperature, control pattern weight | Poor nodularization rejection reduced by about 86.9% |
| Poor nodularization | Magnesium fade, inoculation fade, high CE, graphite flotation | Transfer time, nodulizer recovery, inoculant timing, residual Mg | Shorten transfer, preheat ladle, standardize treatment, control Mg | Rejection reached zero in final recorded months |
We also expressed the relationship between local solidification time and graphite flotation as a process criterion. For a given section thickness \(H\), the flotation criterion can be written as:
$$H \le v_s t_l$$
If the inequality is satisfied, graphite can travel a distance comparable to the section thickness before the local iron solidifies. To prevent flotation, we can either reduce \(v_s\) or reduce \(t_l\). Reducing \(v_s\) can be achieved by lowering the effective graphite size or increasing viscosity, but these are difficult to control directly. Reducing \(t_l\) is more practical, and it can be achieved by lowering pouring temperature, controlling sand temperature, reducing holding time, and optimizing the cooling modulus. Reducing the amount of free carbon from the lost foam pattern also reduces the effective graphite supply.
The cooling rate can be estimated as:
$$\dot{T} = \frac{T_p – T_m}{t_s}$$
where \(\dot{T}\) is the cooling rate, \(T_p\) is the pouring temperature, \(T_m\) is the mold or sand temperature, and \(t_s\) is the solidification time. A higher cooling rate reduces \(t_l\) and therefore reduces graphite flotation. In our lost foam casting process, we could not increase the cooling rate arbitrarily because too fast cooling can cause other defects and increase residual stresses. Therefore, we optimized the cooling rate through sand temperature control, vacuum control, and pouring temperature control.
Quality Control Plan for Sustained Production
To sustain the improvement, we established a quality control plan for lost foam casting of the A16 wheel hub. The plan includes incoming material control, melting control, treatment control, pouring control, lost foam pattern control, sand and vacuum control, inspection, and feedback. The plan is summarized in the following table.
| Stage | Control item | Target or action | Responsibility | Frequency |
|---|---|---|---|---|
| Incoming material | Pig iron, scrap, carburizer, nodulizer, inoculant | Certified chemistry and size | Material control | Every lot |
| Pattern | Pattern weight and density | Within specified range | Pattern workshop | Daily |
| Pattern | Pattern carbon content | Verified by supplier | Quality control | Every batch |
| Coating | Coating thickness and drying | Specified | Coating operator | Every shift |
| Melting | Charge sequence and carburizer addition | Before melting, in batches | Melter | Every heat |
| Melting | Carbon and silicon | CE 4.50–4.70% | Melter and spectrometer | Every heat |
| Treatment | Nodulizer addition | Controlled to target residual Mg | Treatment operator | Every ladle |
| Treatment | Inoculant addition | Controlled timing and amount | Treatment operator | Every ladle |
| Pouring | Pouring temperature | 1440–1460 °C | Pouring operator | Every ladle |
| Pouring | Vacuum | -0.065 to -0.075 MPa | Vacuum operator | Continuous |
| Sand | Sand temperature | Specified range | Sand system operator | Every shift |
| Solidification | Holding time | Process instruction | Pouring operator | Every pour |
| Inspection | Visual and dimensional | No visible defects | Inspector | Every piece |
| Inspection | Metallography | Nodularity and graphite form acceptable | Laboratory | Sampling plan |
| Inspection | Sectioning for shrinkage | No unacceptable internal defects | Laboratory | Sampling plan |
| Feedback | Defect review | Daily or weekly review | Production and quality | Scheduled |
We also used a simple statistical model to monitor the reject rate. The reject rate for a given defect is:
$$R = \frac{N_{defect}}{N_{total}} \times 100$$
where \(N_{defect}\) is the number of rejected castings for that defect and \(N_{total}\) is the total number of castings produced. We plotted the monthly reject rate and applied control limits. When a trend appeared, we reviewed the process variables in the order of priority: residual magnesium, carbon equivalent, pouring temperature, pattern weight, sand temperature, vacuum level, and transfer time. This sequence allowed us to respond quickly without making unnecessary changes.
Discussion of Lost Foam Casting Specifics
Lost foam casting differs from conventional sand casting in several ways that affect ductile iron quality. The pattern remains in the mold during pouring and decomposes as the metal advances. This decomposition consumes heat, generates gas, and can introduce carbon into the iron. The decomposition process also changes the local pressure and the local heat transfer. As a result, the solidification conditions in lost foam casting are more complex than in sand casting. The same chemical composition can produce different results depending on pattern density, coating permeability, sand temperature, and vacuum level.
For the A16 wheel hub, the thick top and side sections were especially sensitive. In these regions, the local cooling modulus was high, so the solidification time was long. The long solidification time allowed graphite to float and allowed shrinkage cavities to grow. The lost foam pattern decomposition added free carbon, which further increased the local carbon equivalent. This made the thick sections more prone to graphite flotation than the thin ribbed sections. At the same time, the thin sections cooled quickly and could develop shrinkage porosity if feeding was insufficient. The process window was therefore narrow and required simultaneous control of chemistry and cooling.
The following equation summarizes the effect of local carbon pickup on the local carbon equivalent:
$$CE_{local} = CE_{bulk} + \frac{[C]_{pickup}}{1} + \frac{\Delta [Si]_{local}}{3}$$
where \(CE_{local}\) is the local carbon equivalent, \(CE_{bulk}\) is the bulk carbon equivalent, \([C]_{pickup}\) is the local carbon pickup from the pattern, and \(\Delta [Si]_{local}\) is the local silicon variation. In lost foam casting, \(CE_{local}\) can be higher than \(CE_{bulk}\) near the metal front and in thick sections. This explains why graphite flotation can occur even when the bulk carbon equivalent appears acceptable. Our control plan therefore included pattern weight, pattern density, and carbon content as critical variables.
We also considered the effect of vacuum on gas removal. The vacuum level influences the removal of decomposition products. If the vacuum is too low, gas can be trapped and cause porosity. If the vacuum is too high, the mold can compact excessively and change the cooling rate. We maintained the vacuum in the range of -0.065 to -0.075 MPa and cleaned the vacuum pipes regularly. This helped stabilize the lost foam casting process.
The sand temperature also influences the cooling rate. The sand acts as a heat sink and as a medium for vacuum transmission. If the sand temperature is too high, the casting cools slowly and graphite flotation increases. If the sand temperature is too low, the casting cools quickly and shrinkage porosity may increase. We controlled the sand temperature within a specified range and recorded it every shift. This reduced the heat-to-heat variation in solidification time.
Economic and Production Impact
The reduction in reject rate had a direct economic benefit. Before improvement, the combined rejection rate from shrinkage and poor nodularization was high. After improvement, the combined average dropped from about 13.7% to about 3.8%. For a production quantity of 2100 pieces over six months, this represents a significant reduction in lost castings. The exact savings depend on material cost, melting energy, labor, machining, and inspection cost, but the trend is clear. Lower reject rates also reduce rework, improve delivery reliability, and reduce the risk of defective parts entering service.
| Item | Before improvement | After improvement | Change |
|---|---|---|---|
| Average combined defect rate, % | 13.713 | 3.802 | -9.911 percentage points |
| Relative combined reduction, % | — | — | 72.3% |
| Shrinkage rejection, % | 8.218 | 3.082 | -5.136 percentage points |
| Poor nodularization rejection, % | 5.495 | 0.720 | -4.775 percentage points |
| Production stability | Frequent adjustment | More stable window | Improved |
| Operator confidence | Low due to high reject rate | Higher due to clear controls | Improved |
We also observed that the improved process reduced the need for excessive nodulizer addition. This lowered the consumption of nodulizer and reduced the variation in residual magnesium. The lower carbon equivalent reduced the amount of graphite flotation, which improved machinability and surface quality. The lower pouring temperature reduced the risk of burn-on and gas defects. Overall, the process became more robust.
Conclusion
In our lost foam casting production of the A16 ductile iron wheel hub, the main quality problems were shrinkage cavities and graphite flotation. The shrinkage defects were primarily caused by excessive nodulizer addition and high residual magnesium. High residual magnesium promoted carbide eutectic formation, increased solidification contraction, encouraged coarse primary austenite dendrites, and hindered liquid feeding. Graphite flotation was caused by high carbon equivalent, slow cooling in thick sections, free carbon from the lost foam pattern, and process variation in pouring temperature, sand temperature, vacuum, and holding time.
We implemented a systematic optimization plan for lost foam casting. The plan included reducing nodulizer addition, controlling residual magnesium to 0.035–0.060%, reducing carbon equivalent to 4.50–4.70%, limiting final carbon to no more than 3.80%, limiting final silicon to no more than 2.70%, lowering pouring temperature to 1440–1460 °C, preheating the ladle and ladle cover, maintaining a 10 min holding period at 1520–1540 °C before tapping, adding carburizer before melting in batches, improving pattern weight and density control, and tightening sand temperature, vacuum, and holding time control.
After implementation, the poor nodularization rejection rate decreased from an average of 5.495% to 0.720%, a relative reduction of about 86.9%. The shrinkage rejection rate decreased from an average of 8.218% to 3.082%, a relative reduction of about 62.5%. The combined defect rate decreased from about 13.713% to about 3.802%, a relative reduction of about 72.3%. These results demonstrate that a coupled control strategy is effective for lost foam casting of ductile iron. The key is to treat residual magnesium, carbon equivalent, pouring temperature, carburizer practice, pattern behavior, and cooling conditions as interacting variables rather than independent settings. By doing so, we achieved stable production, lower reject rates, and improved quality of the A16 wheel hub in lost foam casting.
$$R_{total} = R_{shrinkage} + R_{graphite} + R_{other}$$
$$R_{total,optimized} < R_{total,baseline}$$
$$CE_{optimized} \in [4.50, 4.70]$$
$$Mg_{residual,optimized} \in [0.035, 0.060]$$
These relationships summarize the core of our quality control approach for lost foam casting of ductile iron wheel hubs. The process window is not defined by a single value but by the balance among carbon equivalent, residual magnesium, cooling rate, and pattern decomposition behavior. When this balance is maintained, shrinkage and graphite flotation are both suppressed, and the lost foam casting process can deliver consistent, high-quality ductile iron components.