
Sand casting remains one of the most widely employed manufacturing processes for producing metallic components, especially for complex geometries and large-scale parts. The quality of sand casting parts is directly influenced by the dimensional accuracy of the mold assembly, which involves the precise positioning of cores and the outer mold cavity. In this thesis, I focus on the technical challenges of mold assembly quality control in sand casting processes. I propose systematic methods that span from the early design stage, through assembly quality prediction, to the physical assembly stage where inspection tools are designed based on optimized detection points. The overall goal is to improve the dimensional stability and consistency of sand casting parts while reducing labor intensity and reliance on operator experience.
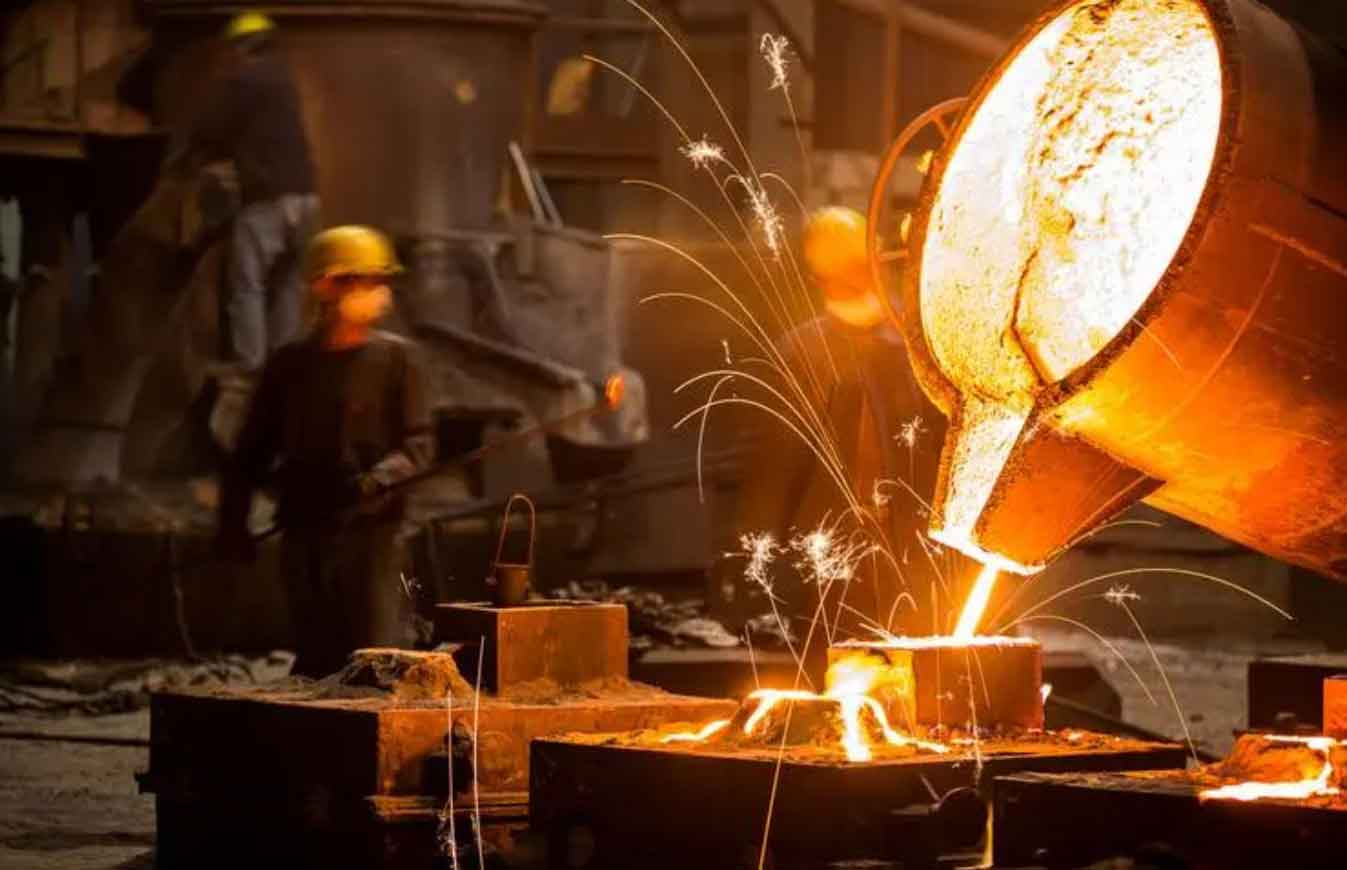
The manufacturing environment for sand casting parts is often characterized by multi-stage processes, where dimensional errors accumulate through serial and parallel assembly operations. Traditional quality control methods are mostly reactive, focusing on final inspection rather than proactive error prevention. Consequently, defects in sand casting parts, such as uneven wall thickness, misalignment, and poor surface integrity, frequently arise from insufficient control during mold assembly. To address this, my research establishes a comprehensive quality control framework that integrates mathematical modeling, state-space representation, topological analysis, optimization of detection points, and inspection tool design. This framework enables better prediction, monitoring, and adjustment of assembly quality throughout the production cycle.
1. Introduction and Problem Statement
In modern foundry industry, the demand for high-precision sand casting parts has increased significantly. However, the inherent variability in sand mold assembly often leads to dimensional deviations that exceed allowable tolerances. The assembly of sand cores and molds is a critical step because it determines the final cavity geometry and, consequently, the geometry of sand casting parts. I argue that improving assembly quality control is as important as controlling the individual component tolerances. The main error sources include dimensional tolerances of cores, form and positional tolerances of core features, and fixture or tooling deviations. These errors propagate through the assembly chain and ultimately manifest as wall-thickness variations or geometric distortions in the finished sand casting parts.
My research therefore addresses the following key questions: How can assembly quality be predicted before actual production? How should inspection points be optimized so that the measured data truly reflects the assembly quality of sand casting parts? And how can inspection tools be designed to support efficient and reliable assembly quality verification? To answer these questions, I propose a three-stage methodology:
- Stage 1: Prediction of mold assembly quality using a state-space model that quantifies error propagation and accumulation.
- Stage 2: Optimization of detection point distribution based on topological relationships among cores and the assembly quality attributes.
- Stage 3: Design of an inspection tool group (or “inspection group”) that implements the optimized detection plan and provides systematic, topology-based verification during assembly.
Finally, I validate the proposed methodology by comparing statistical distributions of wall-thickness data from sand casting parts produced under traditional and controlled assembly conditions. The results demonstrate that the proposed control methods significantly reduce variability and improve the consistency of sand casting parts.
2. Literature Review and Research Background
Extensive research has been dedicated to assembly quality control in industries such as automotive body assembly and aerospace structures. Hu and colleagues introduced the stream-of-variation theory, which employs state-space models to analyze and predict error propagation in multi-station assembly processes. Agrawal et al. developed regression models for variation propagation in multi-station assembly, but these models rely heavily on statistical data and do not explicitly relate physical error sources to dimensional deviations. Tian and colleagues applied state-space models to sheet-metal assembly, where fixture errors dominate. However, sand casting mold assembly presents unique challenges: the assembly is not a simple serial chain, but a combination of serial and parallel sub-assemblies forming a closed cavity. The final quality attribute of interest is often a continuous internal cavity surface rather than a finite set of key points.
In the field of detection point optimization, methods such as equal spacing, equal chord height, and adaptive sampling have been investigated. Equal spacing is simple but inefficient for complex surfaces. Adaptive methods place more points where geometric features change rapidly and fewer points in smooth regions. For sand casting parts, the assembly quality is affected by both the relative positions of cores and the shape of the cavity. Therefore, detection points must capture not only individual core positions but also the interactions between adjacent cores. My work builds on these foundations by introducing a topology-based description of core positions and optimizing detection points according to six-degree-of-freedom constraints and quality attribute sensitivity.
Inspection tool design has traditionally focused on individual gauges for specific features. For complex mold assemblies, however, a single gauge cannot capture the overall assembly quality. I propose the concept of an “inspection group” — a set of inspection tools that work together in a coordinated manner to provide topological detection. This concept aligns with modern system-level quality control thinking, where individual measurement activities are integrated into a coherent verification strategy.
3. Modeling and Prediction of Mold Assembly Quality for Sand Casting Parts
3.1 Error Sources in Mold Assembly
For sand casting parts, the mold assembly process involves positioning sand cores relative to each other and to the outer mold (or flask). The major error sources are:
| Error Source | Type | Effect on Sand Casting Parts |
|---|---|---|
| Core geometric feature position deviation | Positional and orientation errors (distance, coaxiality, symmetry) | Wall thickness variation, misalignment |
| Core geometric form deviation | Flatness, cylindricity, straightness | Local geometry errors, surface defects |
| Tooling and fixture position errors | Fixture location, clamping errors | Systematic assembly deviations |
These errors are not independent; they are coupled and accumulate along the assembly sequence. A state-space formulation is suitable to describe this dynamic accumulation process.
3.2 State-Space Representation of Assembly Process
I consider each sand core and the sand mold as rigid bodies. The assembly process is divided into \(N\) stations. At station \(k\), the state vector \(x_k\) represents the deviation of the sub-assembly from its nominal position and orientation. The state-space model for assembly error propagation is:
$$
x_k = A_{k-1} x_{k-1} + B_k u_k + w_k
$$
where \(A_{k-1}\) is the state transition matrix that maps the previous state to the current state, \(B_k\) is the input matrix that maps the process error \(u_k\) (e.g., core positioning error) to the state, and \(w_k\) is the process noise. The observation equation is:
$$
y_k = C_k x_k + v_k
$$
where \(y_k\) is the measured deviation at station \(k\), \(C_k\) is the observation matrix, and \(v_k\) is the measurement noise.
To apply this model to sand casting parts, I define the state vector as the deviations of all critical features of cores and mold. For example, the state vector can include translations and rotations of each core relative to the nominal datum. The transition matrix \(A_{k-1}\) captures the cumulative effect of previous errors. Since the assembly of sand casting parts often includes parallel sub-assemblies, the state-space model must be augmented to represent both serial and parallel connections. This can be achieved by defining a global state vector that contains all sub-assembly states and constructing a block-diagonal transition matrix.
3.3 Coordinate Transformations and Error Propagation
Let us denote the nominal coordinate frame of a core as \(O_k\) and the actual frame as \(O_k^c\). The transformation from the nominal to the actual frame can be represented by a homogeneous transformation matrix:
$$
T_k^c = \begin{bmatrix} R_k & p_k \\ 0 & 1 \end{bmatrix}
$$
where \(R_k\) is a \(3 \times 3\) rotation matrix and \(p_k\) is a \(3 \times 1\) translation vector. For small deviations, \(R_k\) can be approximated as:
$$
R_k \approx I + \begin{bmatrix} 0 & -\gamma_k & \beta_k \\ \gamma_k & 0 & -\alpha_k \\ -\beta_k & \alpha_k & 0 \end{bmatrix}
$$
Here, \(\alpha_k, \beta_k, \gamma_k\) are small rotations about the x, y, and z axes, respectively. The error vector of the \(k\)-th core is then \(e_k = [\Delta x_k, \Delta y_k, \Delta z_k, \Delta\alpha_k, \Delta\beta_k, \Delta\gamma_k]^T\).
For sand casting parts, the critical quality attribute is often the wall thickness distribution. Suppose the internal cavity is formed by a reference core \(Z_0\) and an assembled core \(Z_k\). The wall thickness along a direction defined by a line \(L(\theta)\) can be expressed as:
$$
D(\theta,z) = \sqrt{(x_k – x_0)^2 + (y_k – y_0)^2}
$$
where \((x_0,y_0)\) and \((x_k,y_k)\) are the intersections of the line with the surfaces of \(Z_0\) and \(Z_k\), respectively. This equation is a function of the assembly error state \(x_k\).
3.4 Application Example: State-Space Prediction for a Sand Casting Mold
I applied the state-space model to a typical sand casting mold used for an aerospace housing. The mold consists of four cores arranged around a central reference core. The nominal positions and geometric radii are given in the table below.
| Component | Radius (mm) | Nominal Angle (deg) | Nominal Offset (mm) |
|---|---|---|---|
| \(Z_0\) (reference) | 600 | 0 | 0 |
| \(Z_1\) | 650 | 0 | 824 |
| \(Z_2\) | 650 | -90 | 802 |
| \(Z_3\) | 650 | 180 | 824 |
| \(Z_4\) | 650 | 90 | 802 |
Given the tolerance classes for each component, the predicted deviations are summarized below.
| Component | \(\Delta x\) (mm) | \(\Delta y\) (mm) | \(\Delta \alpha\) (deg) | \(\Delta \beta\) (deg) | \(\Delta \gamma\) (deg) |
|---|---|---|---|---|---|
| \(Z_0\) | ±20.0 | ±20.0 | ±0.80 | ±0.80 | – |
| \(Z_1\), \(Z_3\) | ±30.5 | ±40.3 | ±5.62 | ±5.62 | ±1.25 |
| \(Z_2\), \(Z_4\) | ±20.0 | ±23.5 | ±2.54 | ±2.54 | ±0.95 |
Using these values, I calculated the transformation matrix for core \(Z_1\) as:
$$
T_1^c = \begin{bmatrix}
1.02 & 0 & 0.10 & 31.12 \\
0.01 & 1.02 & 0.10 & 41.44 \\
-0.10 & -0.10 & 1.00 & 0 \\
0 & 0 & 0 & 1
\end{bmatrix}
$$
The resulting cavity wall thickness tolerance model along the critical direction can be expressed by the following equation:
$$
360000 = (0.72x – 0.28y – 0.35z + 20.00)^2 + (0.28x + 0.72y – 0.35z – 20.20)^2
$$
and for core \(Z_1\):
$$
422500 = (1.02x – 0.10z + 31.12)^2 + (-0.01x + 1.02y – 0.10z + 41.44)^2
$$
Solving these equations along the line of interest yields the predicted wall thickness distribution. The maximum deviation can be estimated using the extreme value method. In this case, the predicted variation range was within the allowable tolerance for the HB6103CT9 grade, but closer to the upper limit, indicating that some adjustments might be necessary. Such predictions allow foundry engineers to modify core dimensions or assembly sequence before physical production, thereby reducing scrap and rework of sand casting parts.
4. Detection Point Optimization for Sand Casting Parts Assembly
4.1 Topological Description of Core Positions
In the assembly of sand casting parts, the spatial relationship between cores is as important as their individual positions. Topological relations describe qualitative spatial relationships such as disjoint, touch, intersection, containment, and equality. I use the 9-intersection matrix to formalize these relations. For two objects \(O\) and \(O_i\), the matrix is defined as:
$$
R(O,O_i) = \begin{bmatrix}
I(O) \cap I(O_i) & I(O) \cap B(O_i) & I(O) \cap E(O_i) \\
B(O) \cap I(O_i) & B(O) \cap B(O_i) & B(O) \cap E(O_i) \\
E(O) \cap I(O_i) & E(O) \cap B(O_i) & E(O) \cap E(O_i)
\end{bmatrix}
$$
where \(I,O,B,E\) denote interior, boundary, and exterior sets, respectively. For rigid-body assembly in sand casting, only two topological relations are physically meaningful: disjoint and boundary contact. These are illustrated schematically in my conceptual model.
For a disjoint relation, the inspection tool must bridge the two cores spatially. For a contact relation, the inspection tool must verify the contact quality as well as the relative orientation of the two cores. This topological understanding guides the functional design of inspection tools.
4.2 Quality Attributes and Detection Point Mapping
Each quality attribute of sand casting parts (e.g., wall thickness, geometric parallelism, perpendicularity) is associated with specific detection points on the assembled mold. I propose a systematic mapping from quality attributes to detection points. The mapping process follows the concept of “assembly quality attribute – detection point optimization” model, which ensures that the detection points reflect the true assembly quality of sand casting parts.
The model can be summarized by the following relationship:
$$
\mathbf{q} = f(\mathbf{p}_1, \mathbf{p}_2, \ldots, \mathbf{p}_m)
$$
where \(\mathbf{q}\) is a vector of quality attributes (e.g., wall thickness deviation, coaxiality), and \(\mathbf{p}_i\) are the coordinates of detection points. The function \(f\) is determined by the assembly error propagation model. The objective of detection point optimization is to select the minimal set of points that still provides a reliable estimate of \(\mathbf{q}\).
4.3 Optimization Strategy Based on Degrees of Freedom and Geometric Features
For a rigid body in space, six degrees of freedom must be constrained to define its pose uniquely. In detection point selection, I use a 3-2-1 rule: three points on a primary plane control two rotational and one translational degree of freedom, two points on a secondary plane control one rotational and one translational degree of freedom, and one point on a tertiary plane controls the last translational degree of freedom. This principle is applied to the detection of each core.
For geometric features with complex shapes, additional points are required to capture local deviations. I adopt an adaptive sampling strategy where candidate points are generated densely on the surface, then evaluated based on their contribution to the quality estimate. Points with low contribution are removed. The evaluation metric is based on the sensitivity of the quality attribute to variations in each point:
$$
S_i = \left\| \frac{\partial \mathbf{q}}{\partial \mathbf{p}_i} \right\|
$$
Points with the largest sensitivity values are retained. This method not only reduces the number of points but also improves the representativeness of the measurements.
The optimized detection point set for a typical mold assembly of sand casting parts might be structured as follows:
| Core | Feature to Inspect | Number of Points | Point Distribution |
|---|---|---|---|
| \(Z_1\) | Position and orientation | 6 | 3 on top face, 2 on side face, 1 on front face |
| \(Z_2\) | Wall thickness gap | 8 | Adaptive along cavity curve |
| \(Z_3\) | Coaxiality | 4 | 2 on each side, diametrically opposed |
| \(Z_4\) | Parallelism | 5 | Array on measured plane |
5. Inspection Group Design for Sand Casting Parts Assembly
5.1 Concept of Inspection Group
Traditional inspection tools for sand casting parts are used independently, leading to fragmented measurement results. I propose a novel concept called the inspection group (or “gauge group”), which integrates multiple inspection tools into a coordinated system. The inspection group is designed according to the optimized detection point distribution and the topological relations among cores. It enables continuous, topology-based detection, thereby improving the reliability and efficiency of mold assembly quality verification.
5.2 Design Method for Individual Inspection Devices
Each inspection device in the group is designed through three phases:
- Conceptual design: Define the inspection task, decompose the total function into sub-functions, and determine whether qualitative or quantitative inspection is required.
- Detailed design: Select appropriate measurement mechanisms (contact/non-contact, direct/indirect, single/multi-parameter) and design the positioning mechanism to ensure accurate reference to the mold or core.
- Evaluation and decision: Evaluate the design against functional requirements, manufacturing feasibility, and cost, and select the best solution.
5.3 Positioning Mechanism Design
The positioning mechanism of an inspection device is crucial for stable and accurate measurement. It must establish a deterministic relationship between the inspection device and the mold or core. Based on the detection task, positioning mechanisms can be classified as:
| Type | Application | Example |
|---|---|---|
| Component positioning | Inspect a single core or a sub-assembly | Locating pins on a core print |
| Group positioning | Inspect a group of cores relative to each other | Bridge fixture spanning two cores |
| Tool positioning | Inspect the mold as a whole | Reference brackets on the mold frame |
In the detailed design, I apply the six-degree-of-freedom principle to constrain the inspection device relative to the reference datum. For example, a stable positioning scheme uses three vee-blocks for planar constraint, two pins for rotational constraint, and one support for translational constraint.
5.4 Measurement Mechanism Design
Measurement mechanisms can be based on mechanical comparators, dial indicators, or digital probes. The choice depends on the required accuracy and the accessibility of the detection point. For sand casting parts, the mold environment is often dusty and may have high temperatures; therefore, robust mechanical mechanisms are preferred. The measurement mechanism must be able to reach all optimized detection points without interference.
I designed a prototype inspection group for a specific sand casting mold with four cores and a central reference. The group includes three individual inspection devices:
- Device A measures the horizontal position and yaw of core \(Z_1\). It uses a dial indicator mounted on a sliding bridge.
- Device B checks the vertical alignment and pitch of core \(Z_2\). It uses a plunger probe with a predefined reference surface.
- Device C verifies the overall wall thickness gap by means of a stepped go/no-go gauge.
The inspection group is designed so that all devices share a common datum structure, enabling data integration and topological analysis across the entire mold assembly.
5.5 Precision Design of Inspection Tools
The precision of inspection tools must be higher than the tolerance of the features they measure. For sand casting parts, a common rule is that the inspection tool accuracy should be at least two grades higher than the product tolerance. For example, if the sand casting part is specified to meet HB6103CT9 (grade 9), the inspection tool should have grade 7 accuracy. This rule is captured in the inequality:
$$
\text{Accuracy}_{\text{inspection}} \le \text{Accuracy}_{\text{assembly}} \le \text{Accuracy}_{\text{casting}}
$$
In practice, the inspection tool accuracy can be achieved by proper manufacturing tolerances and by calibrating the tool against master assemblies.
6. Stability Analysis and Evaluation of the Proposed Control Method
6.1 Data Collection from Production
To validate the effectiveness of the proposed quality control methods, I collected wall-thickness data from sand casting parts produced under two different conditions: (a) traditional mold assembly without systematic control, and (b) mold assembly using the state-space prediction, optimized detection points, and inspection group. From each production mode, I randomly selected 20 wall-thickness measurements. The data are labeled Sample 1 (traditional) and Sample 2 (controlled). The acceptable wall-thickness range is [11.2, 12.8] mm.
| No. | Value | No. | Value | No. | Value | No. | Value | No. | Value |
|---|---|---|---|---|---|---|---|---|---|
| 1 | 12.61 | 5 | 12.17 | 9 | 11.38 | 13 | 12.54 | 17 | 11.98 |
| 2 | 12.58 | 6 | 12.07 | 10 | 12.63 | 14 | 12.80 | 18 | 11.97 |
| 3 | 12.74 | 7 | 11.92 | 11 | 12.75 | 15 | 11.89 | 19 | 11.34 |
| 4 | 12.22 | 8 | 11.65 | 12 | 12.63 | 16 | 12.08 | 20 | 12.35 |
| No. | Value | No. | Value | No. | Value | No. | Value | No. | Value |
|---|---|---|---|---|---|---|---|---|---|
| 1 | 12.05 | 5 | 12.44 | 9 | 11.55 | 13 | 11.98 | 17 | 12.44 |
| 2 | 12.07 | 6 | 12.08 | 10 | 12.35 | 14 | 12.46 | 18 | 11.89 |
| 3 | 11.68 | 7 | 11.98 | 11 | 12.00 | 15 | 12.02 | 19 | 12.46 |
| 4 | 12.35 | 8 | 11.64 | 12 | 11.68 | 16 | 11.58 | 20 | 11.88 |
The sample means and variances are computed as:
$$
\bar{x}_1 = 12.22, \quad s_1^2 = 0.19
$$
$$
\bar{x}_2 = 12.03, \quad s_2^2 = 0.09
$$
The line plots of these samples reveal that Sample 2 has a more concentrated distribution around the nominal value, indicating better dimensional stability of sand casting parts. However, graphical inspection alone is insufficient; rigorous statistical tests are required.
6.2 Normality and Variance Homogeneity Tests
I first checked whether the two samples come from normal distributions. I collected 100 measurements from each production mode and grouped them into intervals. The frequency distributions are shown in the tables below.
| Interval (mm) | Frequency |
|---|---|
| 11.2-11.4 | 8 |
| 11.4-11.6 | 13 |
| 11.6-11.8 | 12 |
| 11.8-12.0 | 16 |
| 12.0-12.2 | 18 |
| 12.2-12.4 | 16 |
| 12.4-12.6 | 8 |
| 12.6-12.8 | 9 |
| Interval (mm) | Frequency |
|---|---|
| 11.2-11.4 | 5 |
| 11.4-11.6 | 16 |
| 11.6-11.8 | 14 |
| 11.8-12.0 | 18 |
| 12.0-12.2 | 20 |
| 12.2-12.4 | 14 |
| 12.4-12.6 | 9 |
| 12.6-12.8 | 4 |
The histograms (not shown here) exhibit bell-shaped curves, suggesting approximate normality. I then performed an F-test to compare variances. The test statistic is:
$$
F = \frac{s_1^2}{s_2^2} = \frac{0.19}{0.09} = 2.11
$$
With 19 and 19 degrees of freedom, the critical value at \(\alpha=0.05\) is approximately 2.53. Since \(F < F_{\text{crit}}\), I cannot reject the null hypothesis of equal variances. Therefore, I proceed with the paired \(t\)-test.
6.3 Paired Data Test
To compare the means of the two samples while accounting for the potential correlation, I used a paired data test. I constructed the differences \(D_i = X_i – Y_i\) for \(i=1,\ldots,20\). The differences are listed below.
| No. | D (mm) | No. | D (mm) | No. | D (mm) | No. | D (mm) | No. | D (mm) |
|---|---|---|---|---|---|---|---|---|---|
| 1 | 0.56 | 5 | -0.27 | 9 | -0.17 | 13 | 0.56 | 17 | -0.46 |
| 2 | 0.51 | 6 | -0.01 | 10 | 0.28 | 14 | 0.34 | 18 | 0.08 |
| 3 | 1.06 | 7 | -0.06 | 11 | 0.75 | 15 | -0.13 | 19 | -1.12 |
| 4 | -0.13 | 8 | 0.01 | 12 | 0.95 | 16 | 0.50 | 20 | 0.47 |
The mean and standard deviation of \(D\) are:
$$
\bar{d} = 0.19, \quad s_D = 0.46
$$
The test statistic is:
$$
t = \frac{\bar{d}}{s_D/\sqrt{n}} = \frac{0.19}{0.46/\sqrt{20}} = 1.847
$$
For a two-tailed \(t\)-test with 19 degrees of freedom and \(\alpha=0.1\), the critical value is \(t_{0.05,19}=1.729\). Since \(t=1.847 > 1.729\), I reject the null hypothesis \(H_0: \mu_D = 0\). This indicates that the wall thickness means of the two production modes are significantly different. Specifically, the controlled assembly process yields wall thickness values closer to the nominal target and with smaller variation. Consequently, the quality stability of sand casting parts is improved.
6.4 Discussion
The statistical analysis confirms that the proposed assembly quality control method effectively reduces variability in sand casting parts. The traditional method exhibits a wider spread of wall thickness values, which directly contributes to higher rejection rates and machining difficulties. In contrast, the controlled method, based on state-space prediction and optimized inspection, allows operators to identify and correct assembly deviations early. The use of an inspection group further ensures that deviations are consistently measured across all critical features, not just isolated points.
The improved stability also benefits downstream processes. With more consistent wall thickness, less machining allowance is required, resulting in shorter production cycles and lower material waste. Moreover, the topological detection principle implemented in the inspection group helps maintain the relative positions of multiple cores, which is particularly important for complex sand casting parts with intricate internal passages.
7. Conclusion and Future Work
In this thesis, I have presented a comprehensive methodology for mold assembly quality control in the production of sand casting parts. The main contributions are summarized as follows:
- State-space assembly quality prediction: I developed a state-space model to describe the propagation and accumulation of errors in sand casting mold assembly. The model quantitatively links core tolerances and tooling deviations to final cavity dimensions, enabling prediction of wall thickness variations in sand casting parts.
- Topology-based detection point optimization: I applied the 9-intersection model to represent spatial relations between sand cores. Based on six-degree-of-freedom constraint and sensitivity analysis, I established a systematic method to optimize detection point distribution. This ensures that the measured data truly reflects the assembly quality of sand casting parts.
- Inspection group design: I introduced the concept of an inspection group and established a structured design process for individual inspection devices. The group works as a unified system to provide topological detection, overcoming the limitations of traditional isolated inspection tools.
- Statistical validation: Using paired data analysis and variance comparison, I demonstrated that the proposed quality control method significantly improves the dimensional stability of sand casting parts.
There are several directions for future research. First, the state-space model can be extended to include non-rigid deformations of cores during assembly. Second, the detection point optimization method can be further refined by incorporating machine learning techniques to automatically identify critical features. Third, the inspection group concept can be integrated with digital measurement devices and data acquisition systems to enable real-time statistical process control. Finally, the entire framework can be embedded into a digital twin environment, allowing virtual validation of assembly processes before physical production.
In conclusion, the methods developed in this research provide a solid foundation for improving the quality and reliability of sand casting parts. By moving from experience-based to model-driven quality control, foundries can achieve higher precision, lower costs, and greater customer satisfaction.
Throughout this work, I have emphasized the importance of considering sand casting parts as the final product of a complex assembly system. The interaction between mold components, measurement strategies, and process control is critical to achieving the desired quality. I believe that the systematic approach proposed here can be adapted to a wide range of foundry applications, from automotive components to aerospace housings, and will contribute to the modernization of sand casting production.
Furthermore, the proposed methods reduce the dependence on highly skilled operators by providing clear, quantitative guidance for assembly and inspection. This is especially valuable in an era where foundry labor is becoming scarcer and more expensive. The inspection group approach also minimizes human error by standardizing the positioning and measurement procedures. Although the initial cost of designing and manufacturing such inspection tools may be higher than traditional methods, the long-term benefits in terms of reduced scrap, lower rework, and improved product consistency outweigh the investment.
Finally, I hope that this research inspires further studies in the field of casting assembly quality control. The integration of mathematical modeling, topological analysis, and practical inspection tools offers a promising path toward intelligent manufacturing of sand casting parts.