
In the competitive landscape of modern manufacturing, the sand casting foundry remains a cornerstone for producing complex automotive components. Among these, the Cummins 6BT cylinder head is a critical part used in multiple engine models. Its structure is intricate, with numerous internal passages and thin walls, and the material is HT250 gray cast iron. The cylinder head operates under high thermal and mechanical loads, demanding excellent internal soundness and dimensional accuracy. While advanced foundries in the United States and Brazil adopted self-hardening sand processes for this component, our facility initially relied on an IMF self-hardening sand line. However, due to capacity constraints, we transitioned production to a GF green sand automatic molding line. This shift introduced significant challenges, as the green sand casting foundry environment requires meticulous control of process parameters. The initial internal rejection rate soared to 28.19%, which was economically unsustainable. This article presents a systematic investigation into the root causes of defects and the corrective actions implemented to lower the rejection rate, with a strong focus on the green sand casting foundry practices.
To understand the magnitude of the problem, we collected detailed defect data over a period of several months within our sand casting foundry. The Pareto analysis of the internal rejections is summarized in Table 1. It clearly shows that gas porosity (blowholes) accounted for more than half of all defective castings, making it the primary target for improvement.
| Defect Type | Frequency (pieces) | Cumulative Frequency | Percentage (%) | Cumulative (%) | Individual Rejection Rate (%) |
|---|---|---|---|---|---|
| Gas porosity | 1224 | 1224 | 53.08 | 53.08 | 8.30 |
| Sand inclusion | 393 | 1617 | 17.04 | 70.12 | 2.62 |
| Broken core | 273 | 1890 | 14.30 | 84.42 | 1.82 |
| Slag inclusion | 203 | 2093 | 9.61 | 94.03 | 1.35 |
| Others | 193 | 2286 | 5.97 | 100.00 | 1.29 |
| Total defective | 2286 | 15.38 | |||
| Total inspected | 14995 |
The term “sand casting foundry” encompasses a wide range of variables that influence casting quality. In our case, the analysis revealed four major contributing factors to the high gas porosity defect rate: (1) inadequate sand mixture preparation, (2) poor venting and sealing of sand cores, (3) unstable binder and coating materials, and (4) insufficient core drying. Each of these factors required targeted technical interventions. In the following sections, I will elaborate on the cause‑and‑effect relationships and the specific steps taken to optimize the green sand casting foundry process.
Root Cause Analysis and Corrective Measures
1. Sand Mixture Preparation in the Sand Casting Foundry
The green sand mixture used in our sand casting foundry initially exhibited unstable properties. The moisture content was maintained between 3.7% and 4.2%, which was too high for the complex geometry of the cylinder head. High moisture leads to increased gas evolution during pouring, and if the generated gas cannot escape properly, it becomes trapped in the solidifying metal, forming blowholes. Additionally, the bentonite used was of the calcium‑based type, which has lower activation and water‑holding capacity compared to sodium‑based bentonite. The key parameters affecting green sand behavior are compactability, permeability, moisture, and green compression strength. A fundamental relationship in a green sand casting foundry is the influence of moisture on the compactability and permeability. The empirical formula for gas evolution from a green sand mold can be expressed as:
$$ V_g = k_g \cdot M \cdot V_m $$
where \( V_g \) is the volume of gas generated, \( k_g \) is a constant related to sand composition, \( M \) is the moisture content (%), and \( V_m \) is the mold volume. Clearly, reducing \( M \) directly reduces gas generation. To improve the sand casting foundry performance, we switched from calcium bentonite to activated sodium bentonite. This change increased the bonding efficiency, allowing us to reduce the moisture target from 3.7%–4.2% to 3.5%–3.8%. The new moisture specification is tighter, and we implemented stricter control on the sand preparation cycle. Table 2 compares the old and new sand mixture targets.
| Parameter | Old Specification | New Specification |
|---|---|---|
| Bentonite type | Calcium‑based | Sodium‑based (activated) |
| Moisture content (%) | 3.7 – 4.2 | 3.5 – 3.8 |
| Compactability (%) | 38 – 42 | 36 – 40 |
| Green compression strength (kPa) | 80 – 100 | 85 – 105 |
| Permeability (No.) | 140 – 160 | 150 – 170 |
By stabilizing the sand properties, we achieved more consistent mold hardness and reduced the variability in gas generation. This was a fundamental step toward a more controlled sand casting foundry operation.
2. Core Venting and Sealing in the Sand Casting Foundry
The cylinder head water jacket core is particularly complex. In a sand casting foundry, cores must be adequately vented to allow gases produced by the binder decomposition to escape. Our initial core design had insufficient venting, and the core prints were not properly sealed, causing gas to flow into the metal rather than being exhausted. The core print sealant (fire‑closing) was applied inconsistently, and the vent holes were either missing or too shallow.
We implemented several modifications. First, we added vent plugs in the water jacket core box at location ‘C’ (corresponding to the core print where gas tends to accumulate). The addition of these plugs ensured that the core print was fully formed and allowed a direct path for gas escape. Second, we drilled additional vent holes in the core prints:
- On the top core print (facing the six intake ports), four holes of Ø6 mm were drilled at a 45° angle to a depth of about 40 mm, and a groove 5 mm deep and 6 mm wide was cut to connect these holes.
- On the water jacket core, vent holes were drilled at the front core print (Ø44.4 mm area) with Ø6 mm holes about 30 mm deep, at the rear core print (Ø18 mm area) with Ø3 mm holes about 20 mm deep, and at the five core prints for the sand outlet holes with Ø3 mm holes about 40 mm deep.
The vent geometry can be analyzed using the Hagen‑Poiseuille equation for gas flow through a circular channel:
$$ Q = \frac{\pi \Delta P r^4}{8 \mu L} $$
where \( Q \) is the volumetric flow rate, \( \Delta P \) is the pressure drop across the vent, \( r \) is the radius of the vent hole, \( \mu \) is the gas viscosity, and \( L \) is the length of the vent. By increasing the number of vents and ensuring appropriate diameters, we significantly increased the total venting capacity in the sand casting foundry.
Furthermore, we introduced a fire‑closing (sealing) procedure for the core prints. At location ‘A’, a fire‑clay paste was extruded to seal the joint between the core and the mold. At location ‘C’, a ceramic fiber sealing ring was placed to prevent metal penetration while allowing gas to escape. This improved the gas evacuation path in the sand casting foundry.
We also optimized the pattern of vent pins on the core‑making tooling. Figure 1 (inserted below) illustrates the arrangement of Ø8 mm and Ø6 mm pins to create a network of vent channels that align with the core prints.
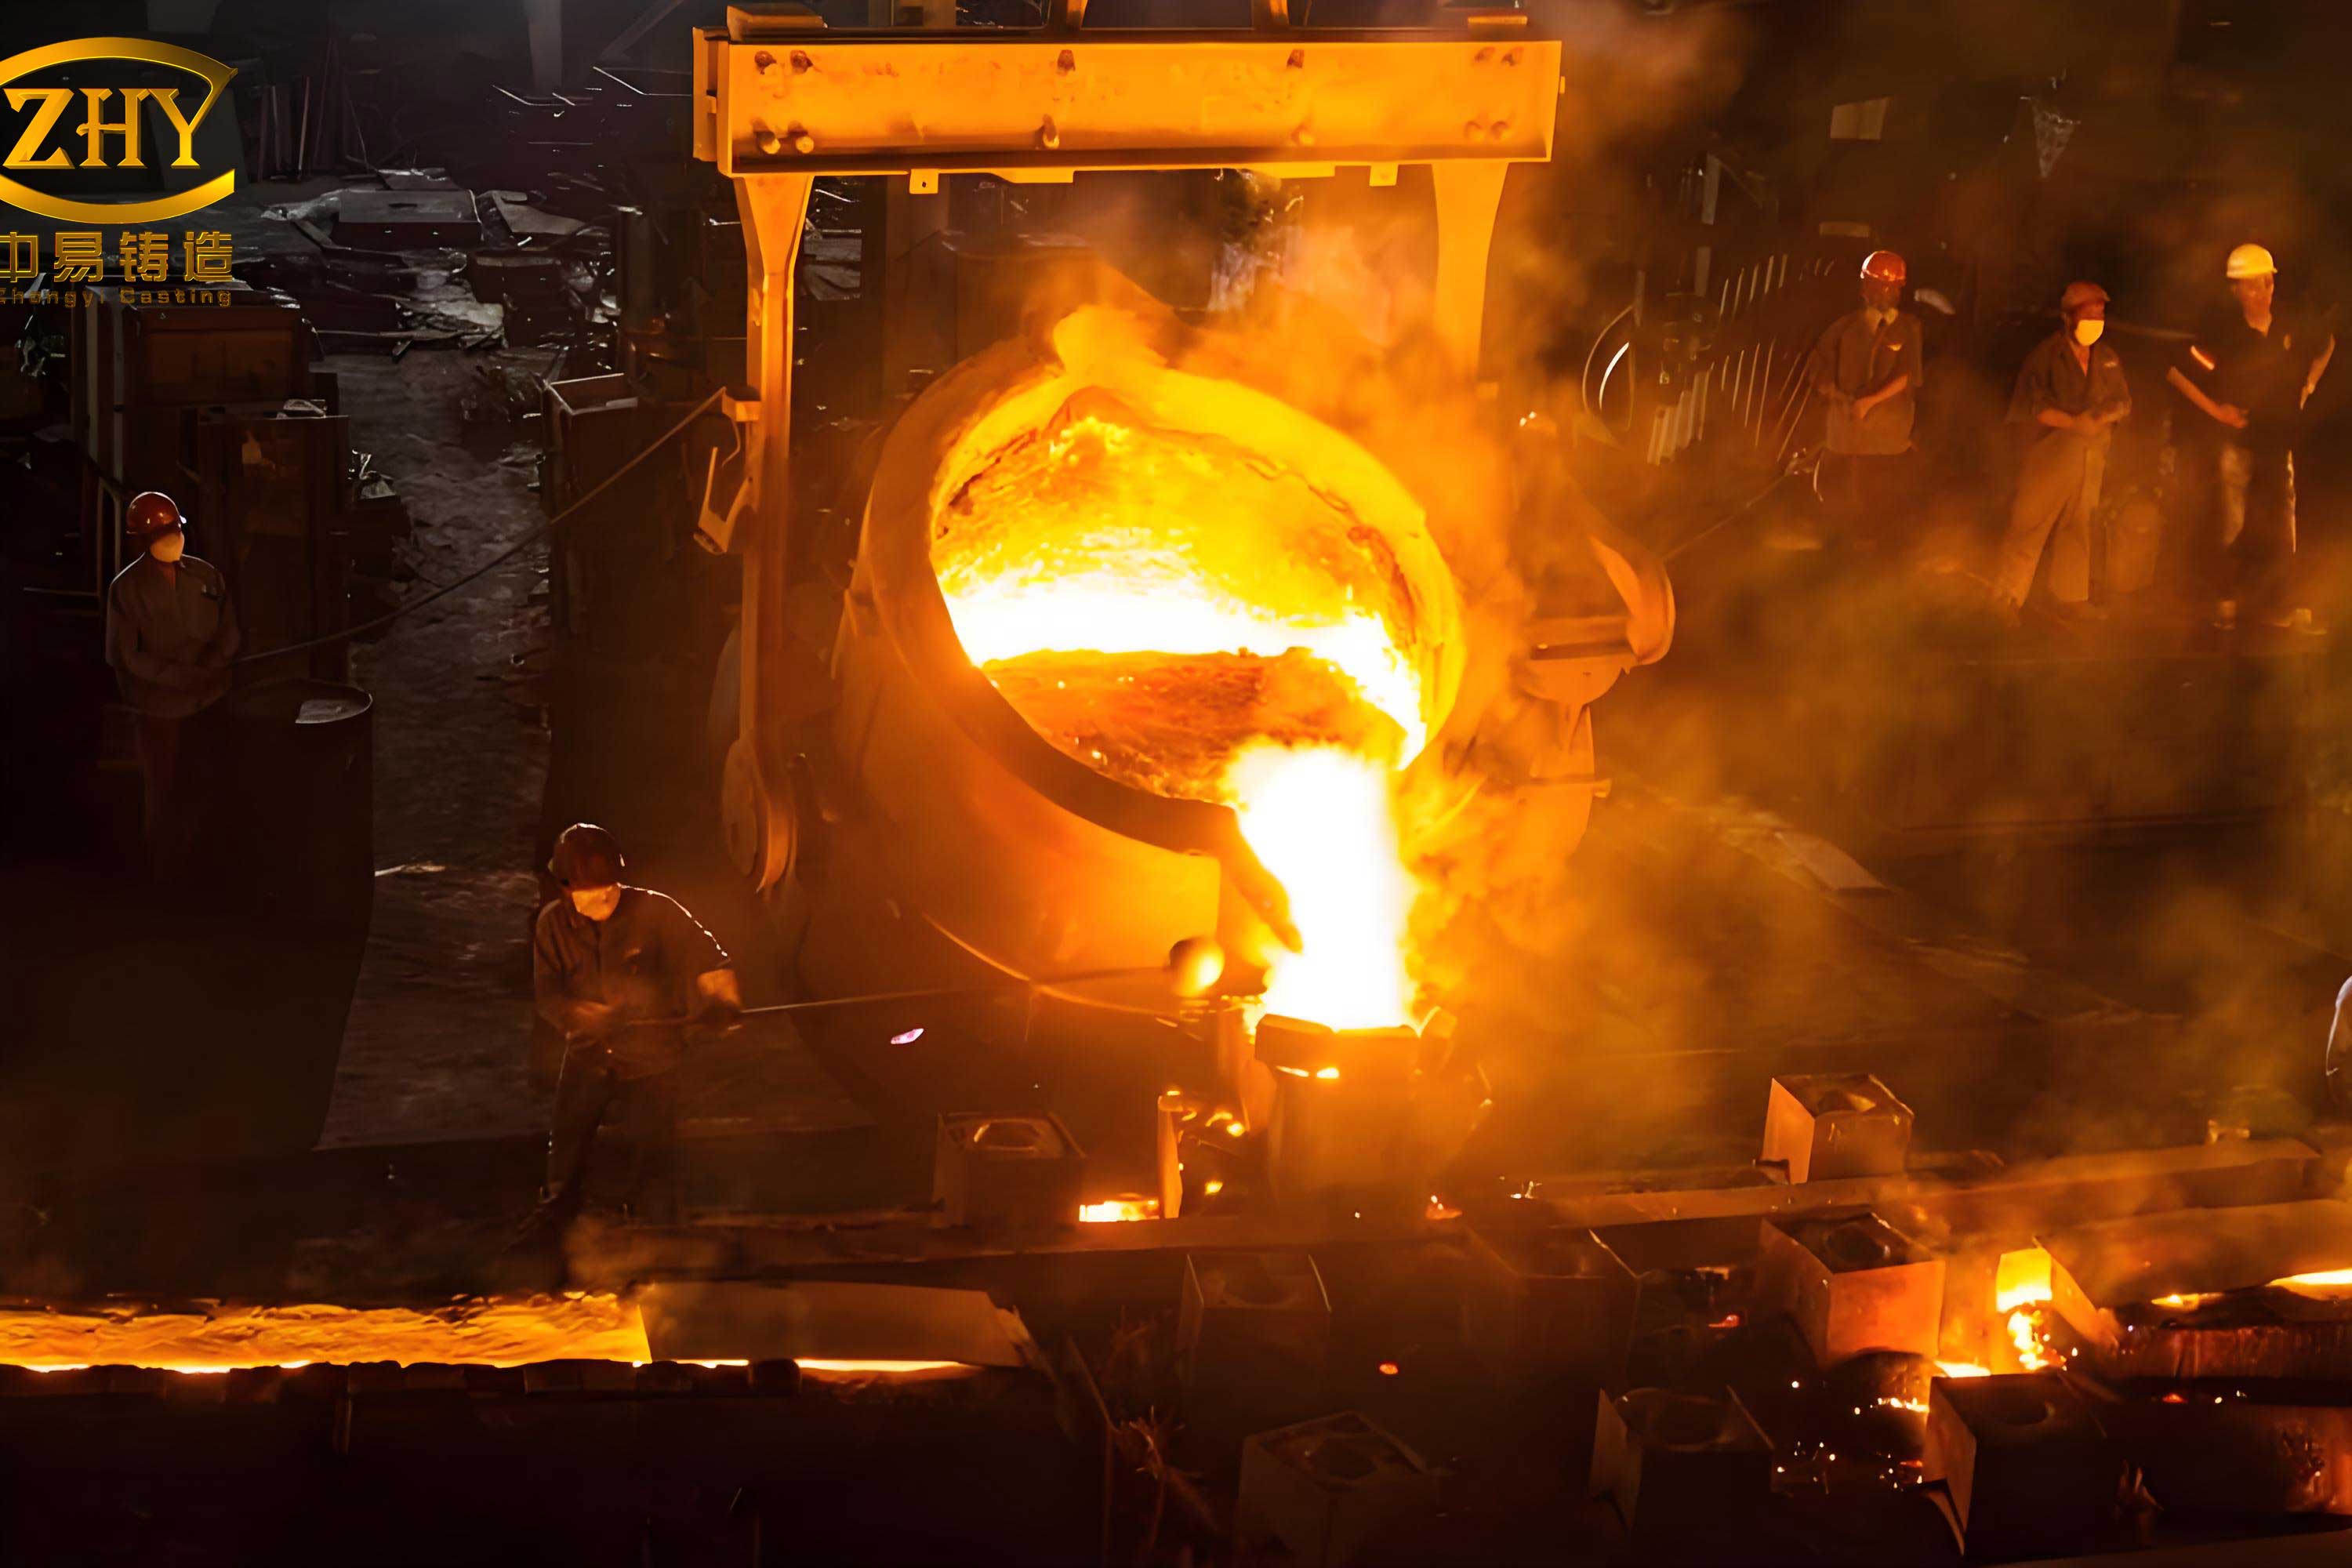
The image above represents a typical complex sand casting foundry part; the venting principles applied to our cylinder head cores are similar. The improved venting design allowed a more efficient gas release during pouring, directly reducing the incidence of blowholes.
3. Core Binder and Coating Stability in the Sand Casting Foundry
The physical properties of the resin‑coated sand used for cores, particularly the gas evolution, varied significantly between batches. This inconsistency led to unpredictable gas generation and made it difficult to control the pouring process. In a well‑regulated sand casting foundry, the gas evolution of a core can be quantified by the weight loss during heating. The total gas volume \( V_c \) from a core can be estimated as:
$$ V_c = m_c \cdot \alpha $$
where \( m_c \) is the mass of the core, and \( \alpha \) is the specific gas evolution coefficient (liters per gram) of the binder system. To ensure \( \alpha \) remains within a narrow range, we increased the sampling frequency of the resin and coating from once per batch to twice per batch. Additionally, we introduced a dual‑supplier (A and B) system for both resin and coating materials, fostering competition and ensuring that only materials meeting stringent specifications were used in our sand casting foundry. For the intake port cores, we replaced the ordinary sand with a high‑temperature‑resistant sand (RenChuang high‑temperature sand), which eliminated the need for a separate coating step and reduced the overall binder content, thereby lowering the gas evolution.
4. Core Drying Process in the Sand Casting Foundry
Improper core drying was another critical factor. The original drying cycle for the water jacket core was 120 minutes at 170–180°C, followed by 45–50 minutes of furnace cooling. However, this schedule often resulted in either under‑cured cores (still containing residual moisture and volatile binders) or over‑cured cores (brittle and prone to cracking). The drying kinetics of a resin‑bonded core can be modeled using the Arrhenius equation for binder curing and moisture diffusion:
$$ \frac{dc}{dt} = -k_0 \exp\left(-\frac{E_a}{RT}\right) C^n $$
where \( C \) is the concentration of volatile components, \( t \) is time, \( k_0 \) is the pre‑exponential factor, \( E_a \) is the activation energy, \( R \) is the gas constant, \( T \) is absolute temperature, and \( n \) is the reaction order. Maintaining a uniform temperature profile and sufficient residence time is essential.
We redesigned the drying schedule to a two‑stage process. The core is first dried at a lower temperature for a specific duration, then removed from the oven for 10 minutes (allowing temperature equalization), and subsequently returned for a second drying cycle. Table 3 summarizes the optimized drying parameters for both the water jacket core and the intake port core in our sand casting foundry.
| Core type | Parameter | Old process | New process |
|---|---|---|---|
| Water jacket core | Drying temperature (°C) | 170 – 180 | 160 – 170 |
| Drying time (min) | 120 | 80 / 40 (two stages with 10 min interval) | |
| Furnace cooling time (min) | 45 – 50 | 45 – 50 | |
| Intake port core | Drying temperature (°C) | 150 – 160 | 140 – 150 |
| Drying time (min) | 90 | 60 / 30 (two stages with 10 min interval) | |
| Furnace cooling time (min) | 45 – 50 | 45 – 50 |
The two‑stage drying ensures a more uniform removal of volatiles without overheating the surface. This improvement in the sand casting foundry core‑making process directly reduced gas‑related defects.
Results and Discussion
After implementing all the above measures in our sand casting foundry, we observed a substantial reduction in the internal rejection rate for the Cummins 6BT cylinder head. The overall reject rate dropped from 28.19% to approximately 12.5% within the first two months of full implementation. The gas porosity defect alone decreased from 8.30% to 3.1%. Table 4 shows the before‑and‑after comparison of rejection rates.
| Defect type | Before (%) | After (%) |
|---|---|---|
| Gas porosity | 8.30 | 3.10 |
| Sand inclusion | 2.62 | 1.40 |
| Broken core | 1.82 | 0.95 |
| Slag inclusion | 1.35 | 0.80 |
| Others | 1.29 | 1.05 |
| Overall | 15.38 | 7.30 |
The success of these interventions underscores the importance of systematic problem solving in a sand casting foundry. By targeting the root causes of the dominant defect—gas porosity—we were able to achieve a significant quality improvement without major capital investment. The key was to control the moisture content of the green sand, enhance core venting, stabilize core binder quality, and optimize core drying.
Further analysis using multiple regression on the process parameters has shown that the most influential variables are moisture content in the sand and the total vent area of the cores. A simplified linear model for the predicted gas porosity reject rate \( R_g \) can be expressed as:
$$ R_g = 0.12 + 0.045 \cdot M – 0.009 \cdot A_v $$
where \( M \) is the average moisture percent in the green sand, and \( A_v \) is the total vent hole cross‑sectional area (in mm²) per core assembly. This empirical relationship, derived from our sand casting foundry data, confirms the inverse relationship between venting capability and gas defects.
It is worth noting that while gas porosity was drastically reduced, it still remains the top defect in our sand casting foundry. Continued monitoring and further refinements—such as the use of advanced venting techniques or vacuum‑assisted mold filling—could be explored. Additionally, the implementation of statistical process control (SPC) charts for sand properties and core drying furnace temperatures will ensure sustained improvement.
Conclusion
This case study demonstrates how a structured approach to defect reduction can yield substantial benefits in a green sand casting foundry. By focusing on the four critical areas—sand mixture, core venting, binder stability, and core drying—we reduced the internal rejection rate of the Cummins 6BT cylinder head from 28.19% to 12.5%. The adoption of sodium‑activated bentonite, lower moisture levels, enhanced core prints with vent plugs, two‑stage core drying, and stricter material inspections were the primary technical changes. The lessons learned are applicable to any sand casting foundry facing similar gas porosity challenges. Continuous improvement remains the goal, and further work is underway to completely eliminate gas‑related defects through advanced simulation and real‑time process monitoring.