
In the field of modern manufacturing, the integration of selective laser sintering (SLS) with vacuum counter-pressure casting offers a promising route to produce complex thin-walled components directly from sand molds. The traditional sand casting foundry process often suffers from low mold strength, poor surface finish, and long lead times. This study focuses on enhancing the performance of SLS resin-coated sand molds through silica sol infiltration, followed by post-curing, and then using these strengthened molds in vacuum counter-pressure casting to fabricate a thin-wall electrical box for aerospace applications. The entire research is conducted from the perspective of a process engineer, aiming to establish a reliable methodology for high-quality sand casting foundry operations.
The concept of sand casting foundry has evolved significantly with the advent of additive manufacturing. SLS enables the direct fabrication of sand molds and cores without the need for pattern tooling, which greatly reduces cost and time for prototype and small-batch production. However, SLS molds typically exhibit low green strength and rough surfaces, restricting their direct use in pressure-assisted casting processes. To overcome these limitations, a post-processing route involving infiltration with colloidal silica and subsequent heat treatment was investigated. The effects of infiltration temperature, infiltration time, post-curing temperature, and post-curing time on the mechanical, physical, and surface properties of SLS molds were systematically studied. Additionally, the casting process parameters for vacuum counter-pressure casting were optimized using ProCAST simulation, focusing on pressure curve, mold temperature, and pouring temperature.
Experimental Procedures
Materials
The base material used in this investigation was a resin-coated sand (RCS) suitable for SLS. The sand particles had a spherical shape with an angularity coefficient not exceeding 1.1, and the particle size ranged from 70 to 140 μm. The binder was a phenolic resin that melts and bonds during laser scanning. The strengthening agent was an alkaline silica sol with a SiO₂ content of 29–31 wt%, a density of 1.20–1.22 g/cm³, and a pH of 9–10. The alloy selected for casting was ZL114A, an Al-Si-Mg alloy, whose chemical composition is listed in Table 1.
| Al | Si | Mg | Ti | Zn | Mn | Cu | Fe |
|---|---|---|---|---|---|---|---|
| Balance | 6.97 | 0.72 | 0.13 | ≤0.20 | ≤0.10 | ≤0.10 | ≤0.084 |
SLS Mold Fabrication
The SLS experiments were conducted on a Laser Core-5300 system. The parameters included a preheating temperature of 60°C, laser power of 45 W for internal scanning and 50 W for external contour, scanning speed of 1.5 m/s, and layer thickness of 0.2 mm. After sintering, the molds were initially cured at 180°C for 2 hours to partially develop the resin bond. These pre-cured specimens then underwent silica sol infiltration and post-curing treatments as detailed below.
Silica Sol Infiltration and Post-Curing
Several sets of experiments were carried out to evaluate the influence of infiltration parameters. The infiltration temperature was varied among 20, 30, 40, 50, and 60°C while keeping a fixed infiltration time of 15 h. Then, the infiltration time was varied among 5, 10, 15, 20, and 25 h at a fixed temperature of 30°C. After infiltration, specimens were air-dried and subsequently post-cured in a forced convection oven. The post-curing temperature was tested at 120, 140, 160, 180, and 200°C for 60 min, and the post-curing time was tested at 30, 60, 90, 120, and 150 min at 180°C. The optimal combination was identified based on mechanical strength and surface roughness.
Performance Testing
Standard test specimens were prepared according to relevant foundry standards. The tensile strength was measured using an XQY-II universal sand strength testing machine with “8” shaped specimens (Figure-like geometry). Flexural strength was determined by three-point bending on rectangular bars of dimensions 70 mm × 11.5 mm × 22.36 mm. Surface roughness (Ra and Rq) was measured with a MahrSurf M 300 portable profilometer. Permeability was tested on cylindrical specimens (φ50 mm × 6 mm) using an ZTY intelligent permeability tester. Gas evolution was measured via a WSPFQX-2000 apparatus at 1000°C. Dimensional accuracy was evaluated with a stepped specimen using a micrometer. Microstructural observation was performed using a scanning electron microscope (SEM) with energy dispersive spectroscopy (EDS) capability.
Results and Discussion
Effect of Infiltration Parameters on Strength
Figures 1 and 2 illustrate the influence of infiltration temperature and time on tensile and flexural strengths. The results indicate that both parameters significantly affect the mechanical performance of SLS molds. The optimum tensile strength was achieved at an infiltration temperature of 30°C and an infiltration time of 15 h. Below these values, an increase in temperature or time promotes molecular mobility and diffusion of silica sol, leading to the formation of larger and additional connection necks at the sand grain contacts. Above the optimum, the viscosity of the silica sol increases and infiltration becomes less effective, while prolonged immersion may weaken the resin bond due to hydrolytic degradation. The maximum tensile strength reached 3.447 MPa, which is about 2.6 times higher than that of untreated SLS molds (1.32 MPa).
The strength enhancement can be understood through the following mechanisms. The infiltration stage primarily involves surface and volume diffusion of silica particles, which bridge the gaps between sand grains and enlarge existing sintering necks. Upon post-curing, the resin softens and flows together with the silica, creating a homogeneous composite binder. This combined effect can be modeled by a viscous flow-assisted diffusion mechanism.
| Temperature (°C) | Tensile strength (MPa) | Flexural strength (MPa) |
|---|---|---|
| 20 | 2.12 | 4.35 |
| 30 | 3.45 | 6.20 |
| 40 | 2.98 | 5.40 |
| 50 | 2.41 | 4.72 |
| 60 | 1.95 | 4.10 |
Effect on Surface Roughness
The surface roughness of SLS molds is a critical factor influencing the final casting quality. As shown in Figure 3 and 4, both infiltration temperature and time exhibited a clear minimum in Ra and Rq values. The best surface finish was obtained at 30°C and 15 h, corresponding to the conditions that also produced the highest strength. The silica sol fills the voids and irregularities on the mold surface, creating a smoother and denser skin. Beyond the optimum, the roughness increased, likely due to the formation of agglomerates or the partial dissolution of the resin binder.
Effect on Permeability
Permeability is essential for venting gases during pouring, especially in vacuum counter-pressure casting. Figure 5 demonstrates that permeability gradually decreases with increasing infiltration time, while the effect of post-curing temperature is less pronounced. At the optimal infiltration condition (30°C, 15 h), the permeability was still acceptable for vacuum-assisted casting, provided proper venting channels are designed. The reduced permeability is a result of pore filling by silica gel, which improves density but may hinder gas release. Therefore, a balance must be struck between strength and permeability.
Other Properties
The collapsibility of the infiltrated SLS molds was evaluated by measuring residual strength after firing at various temperatures. As illustrated in Figure 7, the residual strength declined sharply as the baking temperature increased, falling to nearly zero at 400°C. This indicates that the silica sol does not significantly impair the collapsibility of the resin-coated sand, which is beneficial for removing the mold after casting. Gas evolution measurements showed that silica sol infiltration had a negligible effect on the total gas generation, which remained around 11 mL/g, well below the foundry limit of 20 mL/g.
Dimensional precision was also assessed. The infiltration process added mass to the specimens, and the greatest mass increase occurred at the optimal infiltration time of 15 h. The dimensions grew slightly after infiltration, which must be compensated for during mold design. The dimensional deviation was more pronounced in the z-axis direction due to layer stacking; hence, appropriate shrink allowances should be incorporated in the SLS build file.
Microstructure and Strengthening Mechanism
SEM observations were carried out on SLS specimens infiltrated for different durations. The micrographs clearly show the progressive formation of silica bridges around the sand grains and filling of interstices. Table 3 presents the EDS analysis of the “neck” region, confirming the presence of silicon and oxygen, which originate from the silica sol. The fracture surfaces exhibited a mixture of cohesive and adhesive failure, indicating that the glassy silica phase enhanced the bond between resin and sand.
| Element | Si | Al | O |
|---|---|---|---|
| Content | 12.57 | 34.78 | 52.66 |
Based on the microstructural evidence, a combined model of “melting–surface/volume diffusion” is proposed to explain the strengthening of SLS molds by silica sol infiltration. During infiltration at 30°C for 15 h, the silica nanoparticles diffuse over the sand surfaces and into the necks, creating new bonds. The subsequent curing step at 180°C for 60 min causes the phenolic resin to melt and flow, blending with the silica and forming a strong hybrid binder.
Vacuum Counter-Pressure Casting Process Optimization
Vacuum counter-pressure casting is a sophisticated method that combines the advantages of vacuum suction, low-pressure casting, and differential pressure casting. It is particularly suited for filling thin-walled and complex cavities. However, the process is sensitive to several parameters, such as the pressure curve, mold temperature, and pouring temperature. In this study, the ProCAST software was employed to simulate the filling and solidification behavior of ZL114A alloy in a thin-wall electrical box mold (dimensions: 220 mm × 120 mm × 66 mm; wall thickness 1.4 mm). The finite element mesh consisted of 274,261 nodes and 1,420,575 elements.
Pressure Curve Design
The liquid metal pressure required to fill the mold can be estimated by
$$\Delta P = \mu \rho g h \quad (1)$$
where \(\Delta P\) is the pressure difference (Pa), \(\mu\) is the resistance coefficient (typically 1–1.5), \(\rho\) is the density of the liquid metal, \(g\) is the gravitational acceleration, and \(h\) is the static head height. The total pressure includes the vacuum level (20 kPa) and the filling pressure increment. For this casting, the calculated filling pressure was about 3.3 kPa, giving a total pressure of 24.5 kPa. The pressure curve was divided into three phases: lifting (0.7 s), filling (0.5–2.0 s), and pressurization (1 s). Three different filling times (0.5, 0.9, and 1.3 s) were evaluated, corresponding to different pressurization rates (Table 4).
| Time (s) | Pressure (kPa) – Scheme 1 | Scheme 2 | Scheme 3 |
|---|---|---|---|
| 0 | 20 | 20 | 20 |
| 0.7 | 21.2 | 21.2 | 21.2 |
| 1.2 | 24.5 | – | – |
| 1.6 | – | 24.5 | – |
| 2.0 | – | – | 24.5 |
| 3.0 | 30 | 30 | 30 |
| 11.0 | 30 | 30 | 30 |
| 13.0 | 20 | 20 | 20 |
Simulation results showed that Scheme 3, with a filling time of 2.0 s, provided the smoothest and most stable filling, avoiding turbulence and gas entrapment. The solidification proceeded in a directional manner from the top to the bottom, which is beneficial for feeding. The hot spot was located in the runner system, and the shrinkage porosity values were below 0.01, indicating a sound casting.
Effect of Mold Temperature
Three mold temperatures (120°C, 135°C, and 150°C) were simulated with a fixed pouring temperature of 720°C and the optimal pressure curve. The results indicated that the mold temperature had a moderate influence on the temperature field but did not change the filling sequence significantly. The lowest shrinkage porosity (0.00983) was obtained at 120°C, which was also the lowest among all schemes. Higher mold temperatures increased the tendency for shrinkage porosity and hot cracks. Therefore, 120°C was selected as the optimal mold temperature for this sand casting foundry practice.
Effect of Pouring Temperature
The pouring temperature was varied between 640°C and 720°C. The simulations showed no significant difference in shrinkage porosity or filling pattern. Since vacuum counter-pressure casting typically requires a pouring temperature 30–60°C lower than gravity casting, 680°C was chosen as a compromise between fluidity and solidification characteristics. The resulting casting had the same defect level as at higher temperatures but with reduced energy consumption and less gas pickup.
Optimal Process Parameters
Combining the simulation results and practical experience, the optimal process parameters for vacuum counter-pressure casting of the thin-wall electrical box are summarized in Table 5.
| Parameter | Value |
|---|---|
| Vacuum pressure (kPa) | 20 |
| Filling pressure difference (kPa) | 35 |
| Pressure holding time (s) | 160 |
| Solidification pressure (kPa) | 300 |
| Mold temperature (°C) | 120 |
| Pouring temperature (°C) | 680 |
Actual Casting Trial
Utilizing the strengthened SLS molds and the optimized casting parameters, a batch of thin-wall electrical box housings was produced. The castings exhibited complete filling, smooth surfaces, and excellent airtightness, outperforming conventionally welded assemblies. The superior quality confirmed the effectiveness of the combined SLS and vacuum counter-pressure route for producing complex thin-wall components in a sand casting foundry environment.
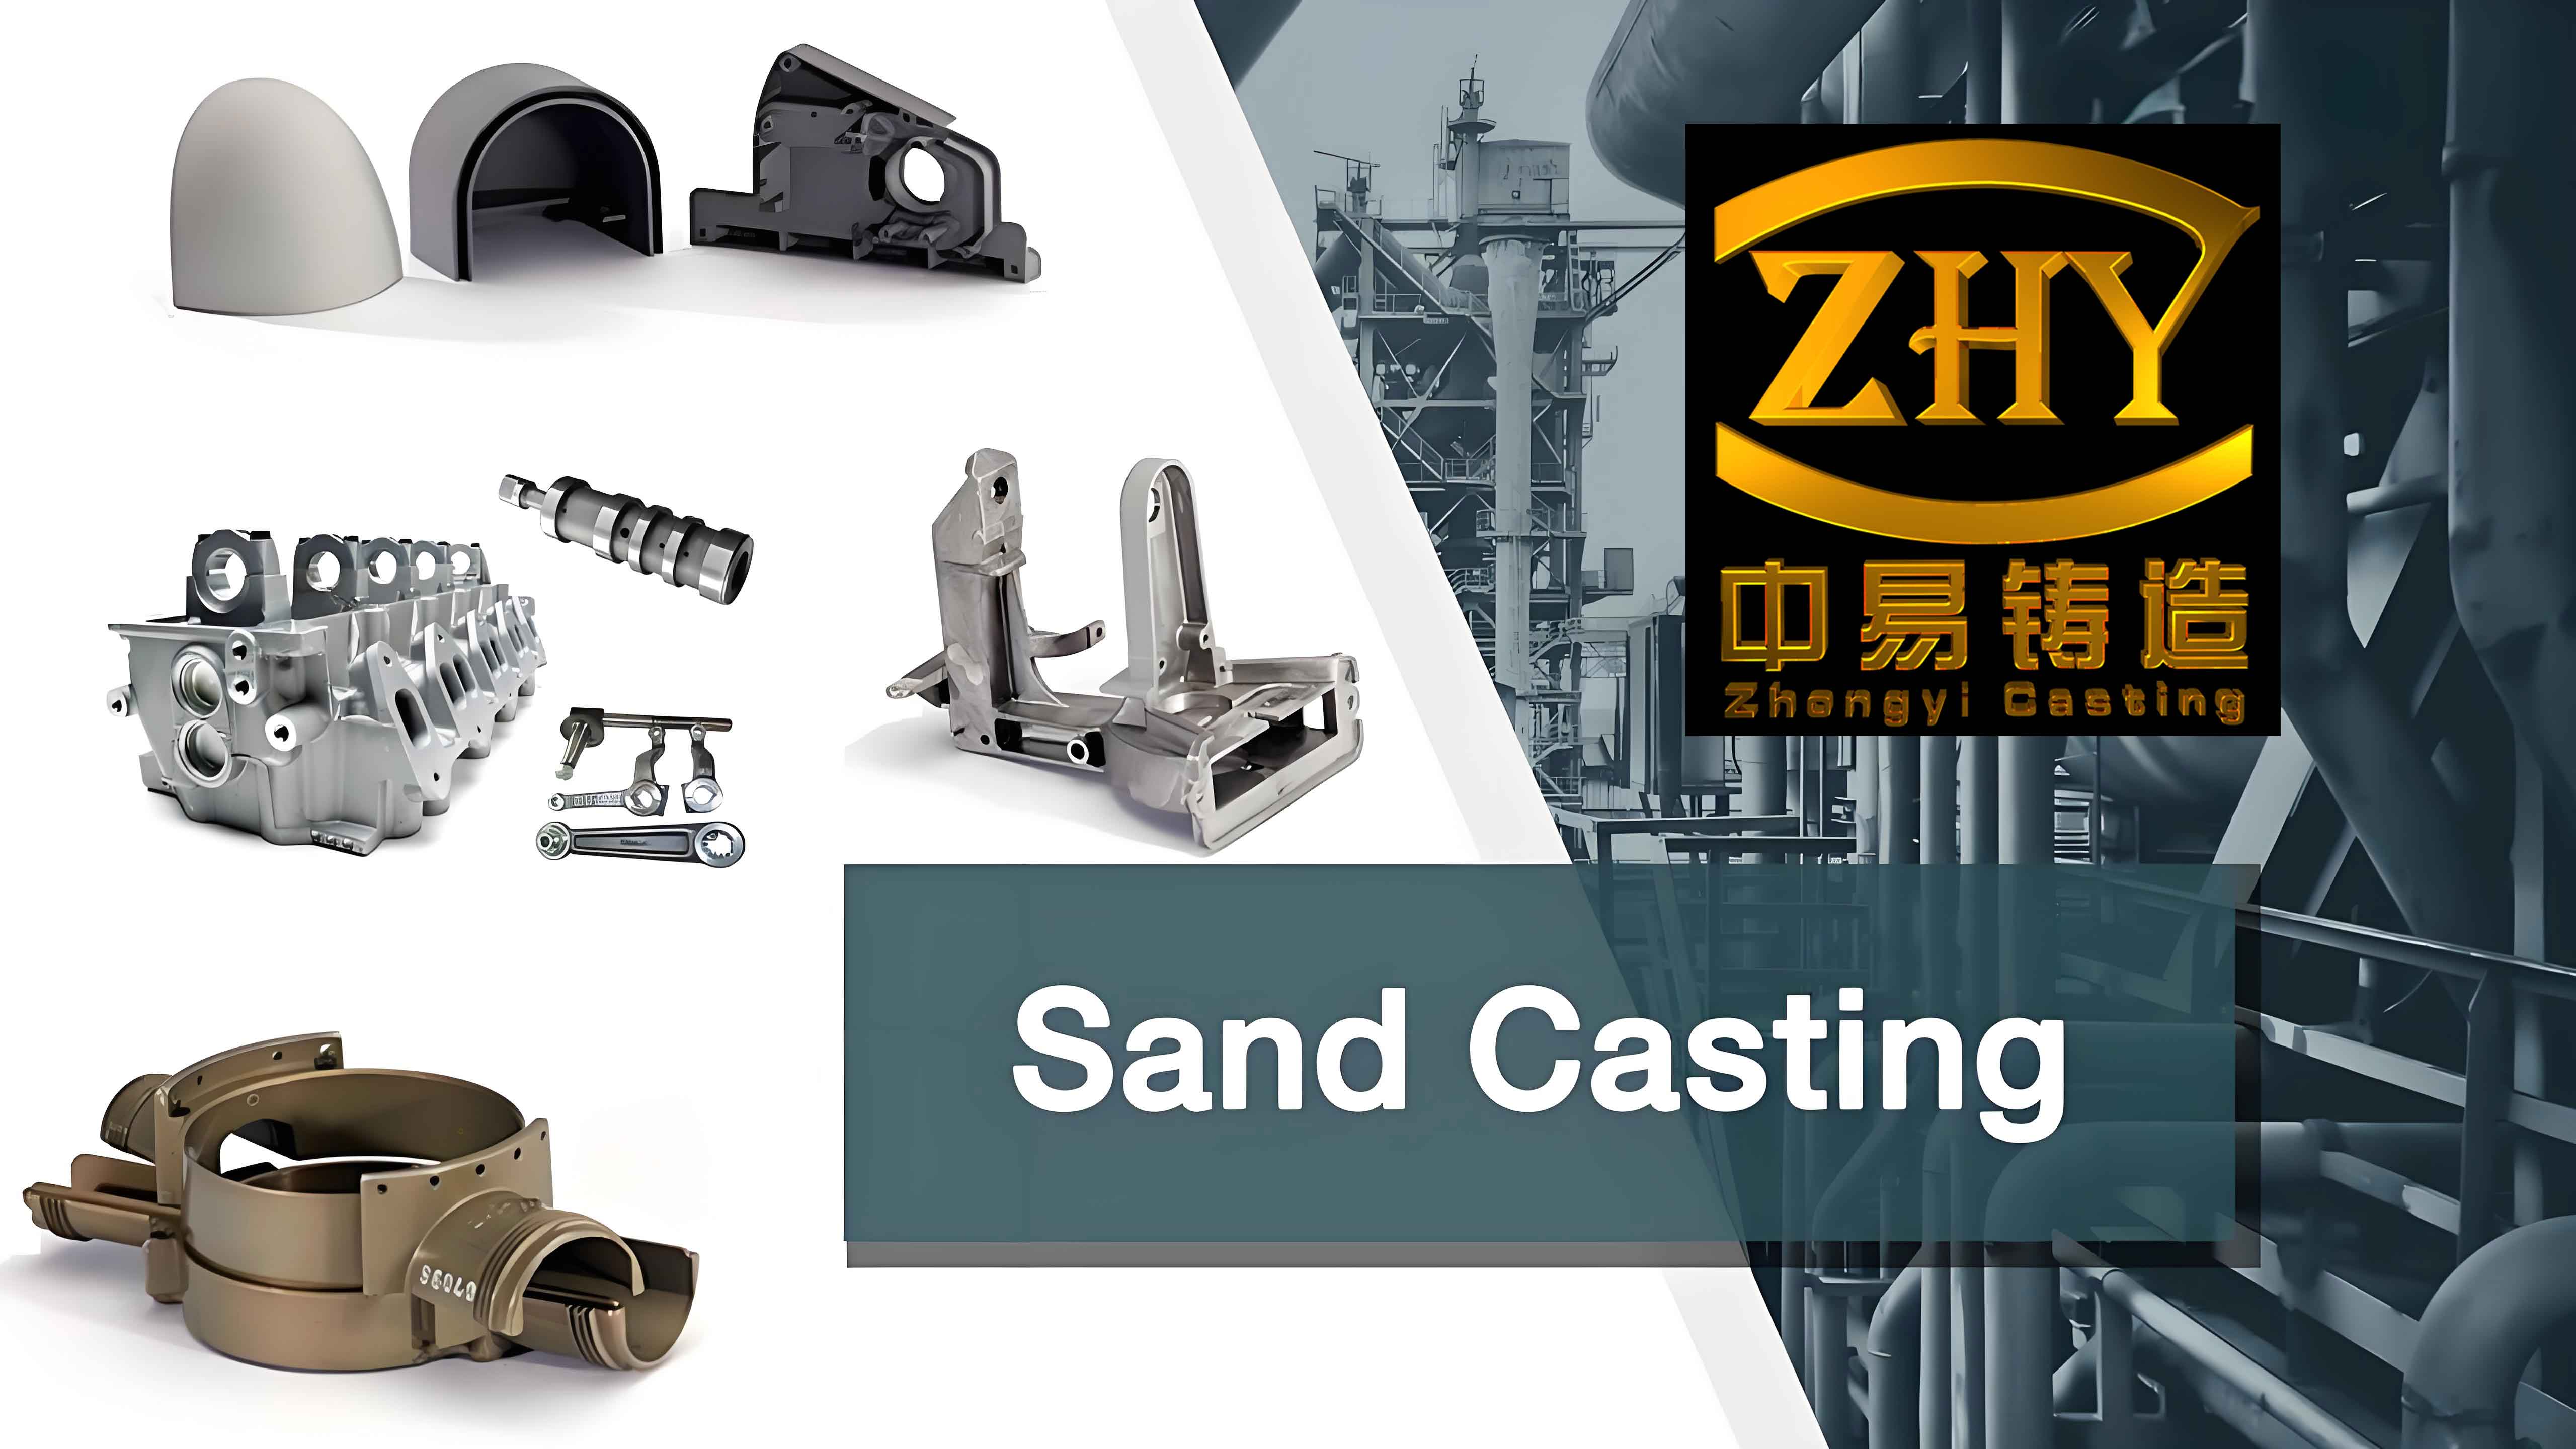
Compared with the traditional forging and welding method, the vacuum counter-pressure cast part showed improved dimensional accuracy and surface finish. The welding joints were eliminated, which substantially increased the pressure tightness. This demonstrates that the integration of SLS and vacuum counter-pressure casting is a viable technology for advanced sand casting foundry applications, especially for aerospace and automotive industries.
Conclusions
In this work, the strengthening of SLS resin-coated sand molds by silica sol infiltration and post-curing was thoroughly investigated. The following conclusions were drawn:
- The infiltration of silica sol significantly enhances the mechanical strength of SLS molds. The optimal parameters are: infiltration temperature 30°C, infiltration time 15 h, post-curing temperature 180°C, and post-curing time 60 min. Under these conditions, the tensile strength increases from 1.32 MPa to 3.447 MPa, an improvement of 160%.
- The surface roughness and permeability of SLS molds are also improved by silica sol infiltration, with the best surface finish occurring at the same optimal parameter set. The strengthening mechanism is attributed to a combination of surface/volume diffusion during infiltration and viscous flow-assisted diffusion during post-curing.
- Infiltration does not negatively affect collapsibility or gas evolution, making the treated molds suitable for a wide range of casting alloys.
- ProCAST simulations revealed that the pressure curve has the most significant effect on filling stability and shrinkage porosity. The optimal pressure curve uses a slow filling time of 2.0 s followed by rapid pressurization.
- Mold temperature and pouring temperature have lesser effects. The best results are obtained with a mold temperature of 120°C and a pouring temperature of 680°C.
- The successful production of thin-wall electrical boxes demonstrates that the combination of silica sol-strengthened SLS molds and vacuum counter-pressure casting is an efficient and reliable method for advanced sand casting foundry operations.
This research provides a theoretical and practical foundation for the rapid and precise manufacturing of complex thin-walled castings using sand casting foundry techniques. Future work will explore the application of other infiltration agents and the optimization of mold venting systems to further improve the casting quality and productivity.