
1.Test result
The large number of tests have been carried out according to the above process plan, and the overall process has gone through three stages of research and development.
(1) Stage I: the mechanical properties and metallographic structure of ductile iron samples fail to meet the requirements of EN 1563:2012, including tensile strength, yield strength, elongation and spheroidization rate. After the project team has discussed and studied the chemical composition of the sample for many times, it is found that the low Si content and low spheroidization rate in the molten iron are the fundamental reasons for the unqualified mechanical properties of the sample. Therefore, measures are formulated to further increase the Si content in the molten iron to a certain range, and the test samples are poured. The results show that the mechanical properties are improved.
(2) The second stage: in order to solve the problem of unqualified performance caused by low spheroidization rate, after a series of research and analysis, it is found that the higher Si content in the molten iron will affect the graphite morphology of nodular cast iron, and the nodular graphite is not round, which will make it flocculent and massive. Therefore, measures should be taken to increase the addition of spheroidizing agent, so as to offset the negative effect of Si on graphite morphology. The results show that the graphite morphology is good, and the spheroidization rate is basically more than 90%.
(3) Stage III: according to the successful scheme of stage II, Y25, U40 and u70 single cast test blocks are poured with molten iron respectively. After a certain period of cooling, the test blocks are unpacked and taken out. Tensile and metallographic samples are prepared on them, and the mechanical properties and metallographic structures are tested in the laboratory.
Table 1 shows some test data of qt600-10 High Silicon Ductile Iron, which are from the performance results obtained from Y25 single cast test block.
| Number of tests | C/% | Si/% | Spheroidization rate /% | Rm /MPa | Rp0.2 /MPa | A/% | Ferrite /% |
| 1 | 3.18 | 3.95 | 91 | 617 | 500 | 19 | >95 |
| 2 | 3.11 | 3.89 | 93 | 612 | 499 | 17 | >95 |
| 3 | 3.15 | 3.94 | 95 | 610 | 493 | 18 | >95 |
| 4 | 3.17 | 3.98 | 89 | 619 | 491 | 15 | >95 |
| 5 | 3.09 | 4.10 | 97 | 628 | 510 | 16 | >95 |
Table 2 shows some test data of qt600-10 high silicon nodular cast iron, which are obtained from the performance results of U40 single cast test block.
| Number of tests | C/% | Si/% | Spheroidization rate /% | Rm /MPa | Rp0.2 /MPa | A/% | Ferrite /% |
| 1 | 3.18 | 3.95 | 92 | 597 | 489 | 15 | >95 |
| 2 | 3.11 | 3.89 | 90 | 594 | 482 | 16 | >95 |
| 3 | 3.15 | 3.94 | 91 | 588 | 485 | 13 | >95 |
| 4 | 3.17 | 3.98 | 91 | 601 | 493 | 14 | >95 |
| 5 | 3.09 | 4.10 | 90 | 611 | 502 | 17 | >95 |
Table 3 shows some test data of qt600-10 high silicon nodular cast iron from the performance results obtained from u70 single cast test block.
| Number of tests | C/% | Si/% | Spheroidization rate /% | Rm /MPa | Rp0.2 /MPa | A/% | Ferrite /% |
| 1 | 3.18 | 3.95 | 92 | 589 | 487 | 16 | >95 |
| 2 | 3.11 | 3.89 | 93 | 590 | 485 | 14 | >95 |
| 3 | 3.15 | 3.94 | 94 | 580 | 483 | 12 | >95 |
| 4 | 3.17 | 3.98 | 90 | 579 | 481 | 13 | >95 |
| 5 | 3.09 | 4.10 | 93 | 586 | 493 | 15 | >95 |
Table 4 shows some test data of qt500-14 high silicon nodular cast iron from the performance results obtained from Y25 single cast test block.
| Number of tests | C/% | Si/% | Spheroidization rate /% | Rm /MPa | Rp0.2 /MPa | A/% | Ferrite /% |
| 1 | 3.23 | 3.65 | 93 | 542 | 450 | 15 | >95 |
| 2 | 3.19 | 3.71 | 95 | 551 | 452 | 16 | >95 |
| 3 | 3.24 | 3.64 | 95 | 536 | 459 | 17 | >95 |
| 4 | 3.30 | 3.68 | 90 | 521 | 443 | 15 | >95 |
| 5 | 3.25 | 3.75 | 91 | 549 | 451 | 14 | >95 |
Table 5 shows some test data of qt500-14 high silicon nodular cast iron. The data are from the performance results of U40 single cast test block.
| Number of tests | C/% | Si/% | Spheroidization rate /% | Rm /MPa | Rp0.2 /MPa | A/% | Ferrite /% |
| 1 | 3.23 | 3.65 | 91 | 533 | 448 | 15 | >95 |
| 2 | 3.19 | 3.71 | 92 | 546 | 453 | 17 | >95 |
| 3 | 3.24 | 3.64 | 90 | 535 | 455 | 15 | >95 |
| 4 | 3.30 | 3.68 | 95 | 522 | 443 | 16 | >95 |
| 5 | 3.25 | 4.75 | 96 | 541 | 441 | 15 | >95 |
Table 6 shows some test data of qt500-14 high silicon nodular cast iron from the performance results obtained from u70 single cast test block.
| Number of tests | C/% | Si/% | Spheroidization rate /% | Rm /MPa | Rp0.2 /MPa | A/% | Ferrite /% |
| 1 | 3.23 | 3.65 | 90 | 529 | 438 | 14 | >95 |
| 2 | 3.19 | 3.71 | 91 | 537 | 446 | 15 | >95 |
| 3 | 3.24 | 3.64 | 92 | 525 | 437 | 15 | >95 |
| 4 | 3.30 | 3.68 | 99 | 520 | 433 | 14 | >95 |
| 5 | 3.25 | 4.75 | 87 | 530 | 441 | 15 | >95 |
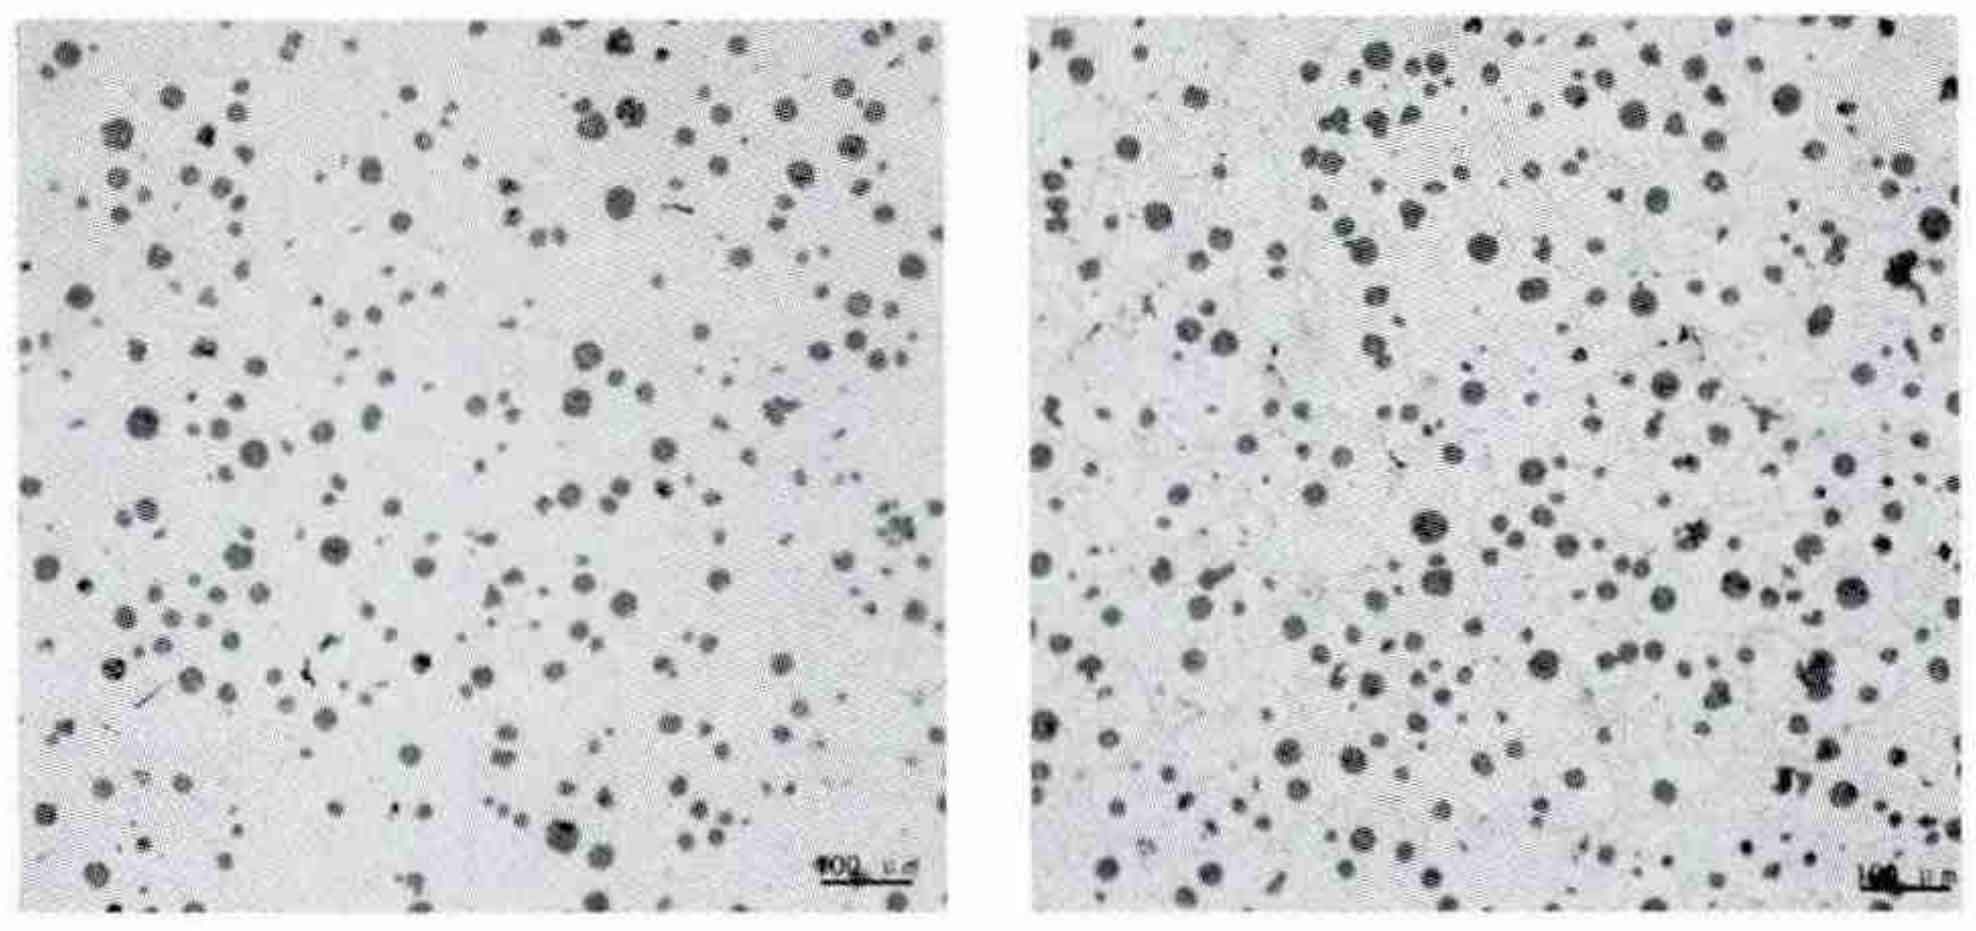
2. Metallographic structure
Select QT500-14 grade Y25 single cast test block, and the metallographic structure of the third test result in Table 6 is shown in the figure.
3. Result analysis
From the mechanical properties and microstructure of nodular cast iron, this process scheme can meet the requirements of EN 1563:2012 standard, and the spheroidization rate can reach more than 85%, indicating that this process scheme can successfully produce qt500-14 and qt600-10 cast iron materials with all ferrite matrix.