
Chapter 1. Introduction and Research Background
The manufacturing industry is undergoing a profound transformation driven by the integration of digital technologies and advanced processing methods. Among these, additive manufacturing, commonly known as 3D printing, has emerged as a pivotal innovation, particularly in the realm of traditional casting. Conventional manufacturing techniques exhibit high sensitivity to part complexity, often resulting in increased costs and lead times for intricate geometries. 3D printing sand casting, as a novel forming method, demonstrates minimal sensitivity to component complexity, thereby enabling the production of highly intricate parts with enhanced efficiency and reduced cost. By synergizing the advantages of 3D printing with the established benefits of traditional casting—such as high production flexibility and material properties—it is possible to achieve integrated, short-cycle, high-precision, and high-value-added manufacturing of castings. This technology offers rapid production response, high efficiency, and lower research and development costs, effectively meeting the growing demands for lightweight, green, and intelligent manufacturing in sectors like automotive, marine, and aerospace engineering.
This research focuses on the application of 3D printing sand casting for complex aluminum alloy components, specifically targeting the production of an automotive engine cylinder block. The core objectives are to investigate the influence of process parameters on the microstructure and mechanical properties of the resulting castings, to design and simulate an optimized casting process for a complex cylinder block, and to validate the simulation through actual production using 3D printed sand molds.
Chapter 2. Experimental Materials and Methodology
2.1 Materials
The primary material used in this study for both the experimental coupons and the target cylinder block was the ZL101A aluminum alloy. This alloy is widely used in automotive applications due to its excellent castability and favorable mechanical properties. A specific composition was prepared, with the addition of Strontium (Sr) to modify the eutectic silicon phase and enhance fluidity. The standard and actual chemical compositions are presented below.
| Element | Si | Mg | Ti | Sr | Fe | Zn | V | Al |
|---|---|---|---|---|---|---|---|---|
| Standard (wt. %) | 6.5-7.5 | 0.25-0.45 | 0.08-0.20 | – | – | – | – | Balance |
| Actual Casting (wt. %) | 7.223 | 0.322 | 0.106 | 0.041 | 0.109 | 0.017 | 0.015 | Balance |
2.2 Equipment and Sand Mold Preparation
A custom-developed PCM-800 3D sand mold printer was utilized for fabricating the sand molds. The printer operates on the principle of binder jetting, where a printhead selectively deposits a furan resin binder onto a bed of pre-mixed sand (silica sand coated with a sulfonic acid-based catalyst). The specifications of the printer include a maximum build volume of 800 × 750 × 500 mm, a resolution of 300 dpi, and a variable layer thickness ranging from 0.2 to 0.5 mm. The standard printing speed is 25 s/layer. The properties of the 3D printed sand were evaluated and are summarized below.
| Property | Value |
|---|---|
| Tensile Strength (Room Temp) | 0.8-1.5 MPa |
| Compressive Strength (Room Temp) | > 2 MPa |
| Bending Strength (Room Temp) | 1-2.5 MPa |
| Permeability | 80-120 |
| Gas Evolution | 12-14 |
2.3 Melting, Casting, and Heat Treatment
The ZL101A alloy was melted in an induction melting furnace. After melting, the melt underwent a rigorous degassing and slag removal process using a rotary impeller and Argon gas. The melt was then modified with a Strontium-based master alloy to refine the eutectic silicon structure. Gravity casting was employed for all experiments. After casting, specific samples and the cylinder block were subjected to a T6 heat treatment, which involved solution treatment at 530 ℃ for 8-12 hours, quenching in warm water (70 ℃), followed by artificial aging at 180 ℃ for 6-8 hours.
Chapter 3. Optimization of 3D Printing Sand Casting Process Parameters
The performance of 3D printing sand casting is highly influenced by both the mold properties and the casting parameters. A systematic study was conducted to compare the performance of castings produced with 3D printed sand molds against those from traditional no-bake sand molds and permanent metal molds. The pouring temperature was 720 ℃, and the molds were dried without preheating.
3.1 Comparative Analysis of Mold Types
The microstructure and mechanical properties of the ZL101A castings produced in different mold types (as-cast condition) were analyzed. The castings from the 3D printed sand mold exhibited a slightly coarser microstructure compared to the traditional sand mold, but with fewer defects such as porosity and inclusions.
| Mold Type | SDAS (μm) | Ultimate Tensile Strength (MPa) | Elongation (%) | Density (g/cm³) |
|---|---|---|---|---|
| Traditional Sand Mold | 63.05 | 127 | 1.9 | 2.6260 |
| 3D Printed Sand Mold | 84.08 | 131 | 2.2 | 2.6300 |
| Metal Mold (Reference) | 25.94 | 184 | 3.4 | 2.6753 |
It was evident that the 3D printed sand mold castings demonstrated comparable, and in some aspects superior, performance to those made with traditional hand-crafted sand molds. The higher density and elongation suggest a lower incidence of internal defects like shrinkage porosity and gas holes, attributed to the uniform and controllable properties of the 3D printed mold. While the metal mold produced finer microstructures and higher ductility, the 3D printed sand mold offers significant advantages in design freedom and manufacturing flexibility for complex parts.
3.2 Influence of Process Temperatures
3.2.1 Effect of Sand Mold Preheating
The effect of preheating the 3D printed sand mold before pouring was investigated. Castings were produced with molds at room temperature (no preheat) and preheated to 100 ℃, 150 ℃, and 200 ℃ and subjected to T6 heat treatment. The results showed a clear trend: increasing the preheat temperature led to a coarser microstructure and lower mechanical properties.
| Mold Preheat Temperature | SDAS after T6 (μm) | Ultimate Tensile Strength after T6 (MPa) | Elongation after T6 (%) |
|---|---|---|---|
| Room Temperature | 57.58 | 218 | 0.4 |
| 100 ℃ | – | – | – |
| 150 ℃ | – | – | – |
| 200 ℃ | 90.72 | 205 | 0.3 |
Preheating the mold slows down the cooling rate of the molten metal, which promotes the coarsening of the dendritic structure and negatively impacts the mechanical properties. For components without special requirements, pouring into a dry, room-temperature mold proves to be more beneficial, as it accelerates solidification and results in a finer, more robust microstructure after T6 treatment.
3.2.2 Effect of Pouring Temperature
The influence of the initial pouring temperature of the aluminum melt was also systematically studied. The temperatures investigated were 700 ℃, 710 ℃, 720 ℃, and 740 ℃. An optimal pouring temperature was identified for 3D printing sand casting.
| Pouring Temperature (℃) | SDAS after T6 (μm) | Ultimate Tensile Strength after T6 (MPa) | Elongation after T6 (%) |
|---|---|---|---|
| 700 | – | – | – |
| 710 | – | – | – |
| 720 | 70.69 | 229 | 0.5 |
| 740 | – | – | – |
A pouring temperature of 720 ℃ yielded the best combination of tensile strength (229 MPa) and acceptable elongation (0.5%) after T6 heat treatment. Pouring at lower temperatures (700 ℃) resulted in incomplete modification of the eutectic silicon and potential flowability issues, leading to premature solidification. Pouring at higher temperatures (740 ℃) caused the melt to absorb more gas and led to a coarser structure, as well as the precipitation of harmful iron-containing intermetallic phases such as β-Fe and π-Fe, which deteriorate the mechanical properties and reduce the casting quality.
3.3 Influence of Printing Layer Thickness
The thickness of the layer in the 3D printing process is a critical parameter that influences the binder content and overall mold density. Two different sand mold groups were prepared, with printing layer thicknesses of 0.4 mm and 0.5 mm. The castings from these molds were compared under standard pouring conditions (720 ℃, mold at room temperature).
| Sand Mold Printing Layer Thickness | SDAS after T6 (μm) | Ultimate Tensile Strength after T6 (MPa) | Elongation after T6 (%) | Density of Cast Sample (g/cm³) |
|---|---|---|---|---|
| 0.4 mm | 57.60 | 218 | 0.4 | 2.6454 |
| 0.5 mm | 70.70 | 229 | 0.5 | 2.6503 |
The samples cast with the 0.5 mm layer thickness molds exhibited superior overall performance. Although the microstructure was slightly coarser, the castings had fewer gas-related defects and a higher density. A thicker printing layer (0.5 mm) contains less total binder per unit volume compared to a thinner layer (0.4 mm) for the same part height. This reduced the amount of gas evolved during pouring, thereby decreasing the likelihood of gas porosity in the cast part. The optimized parameters identified were a layer thickness of 0.5 mm, a printing speed of 25 s/layer, and a single-pass printing strategy.
3.3.1 Theoretical Considerations for Mold Properties
Based on the experimental results, the optimization of process parameters was not merely empirical but also grounded in the physical principles governing the mold and casting. The gas evolution from the mold is a critical factor, described by the total gas evolution rate, which is directly proportional to the binder content:
$$ V_{gas} \propto \rho_{binder} \cdot V_{mold} $$
where ρ_binder is the density of the binder in the mold and V_mold is the volume of the mold. A thinner layer thickness leads to more printed layers and thus a higher weight percentage of binder, increasing the total gas evolution and consequently the risk of porosity in the casting.
Chapter 4. Casting System Design and Simulation for Cylinder Block
The designed component is a three-cylinder inline engine block for a new automotive application. Its complex geometry, with an outer dimension of approximately 500 × 500 × 500 mm and internal features such as water jackets, oil galleries, and an integrated crankcase, makes it a challenging casting. A key feature is the integration of three cast-iron cylinder liners, which are essential for wear resistance and must be thoroughly bonded with the aluminum alloy (ZL101A) during casting. The mold complexity demands a well-designed gating system to ensure defect-free filling and solidification.
4.1 Design of Conformal Gating System
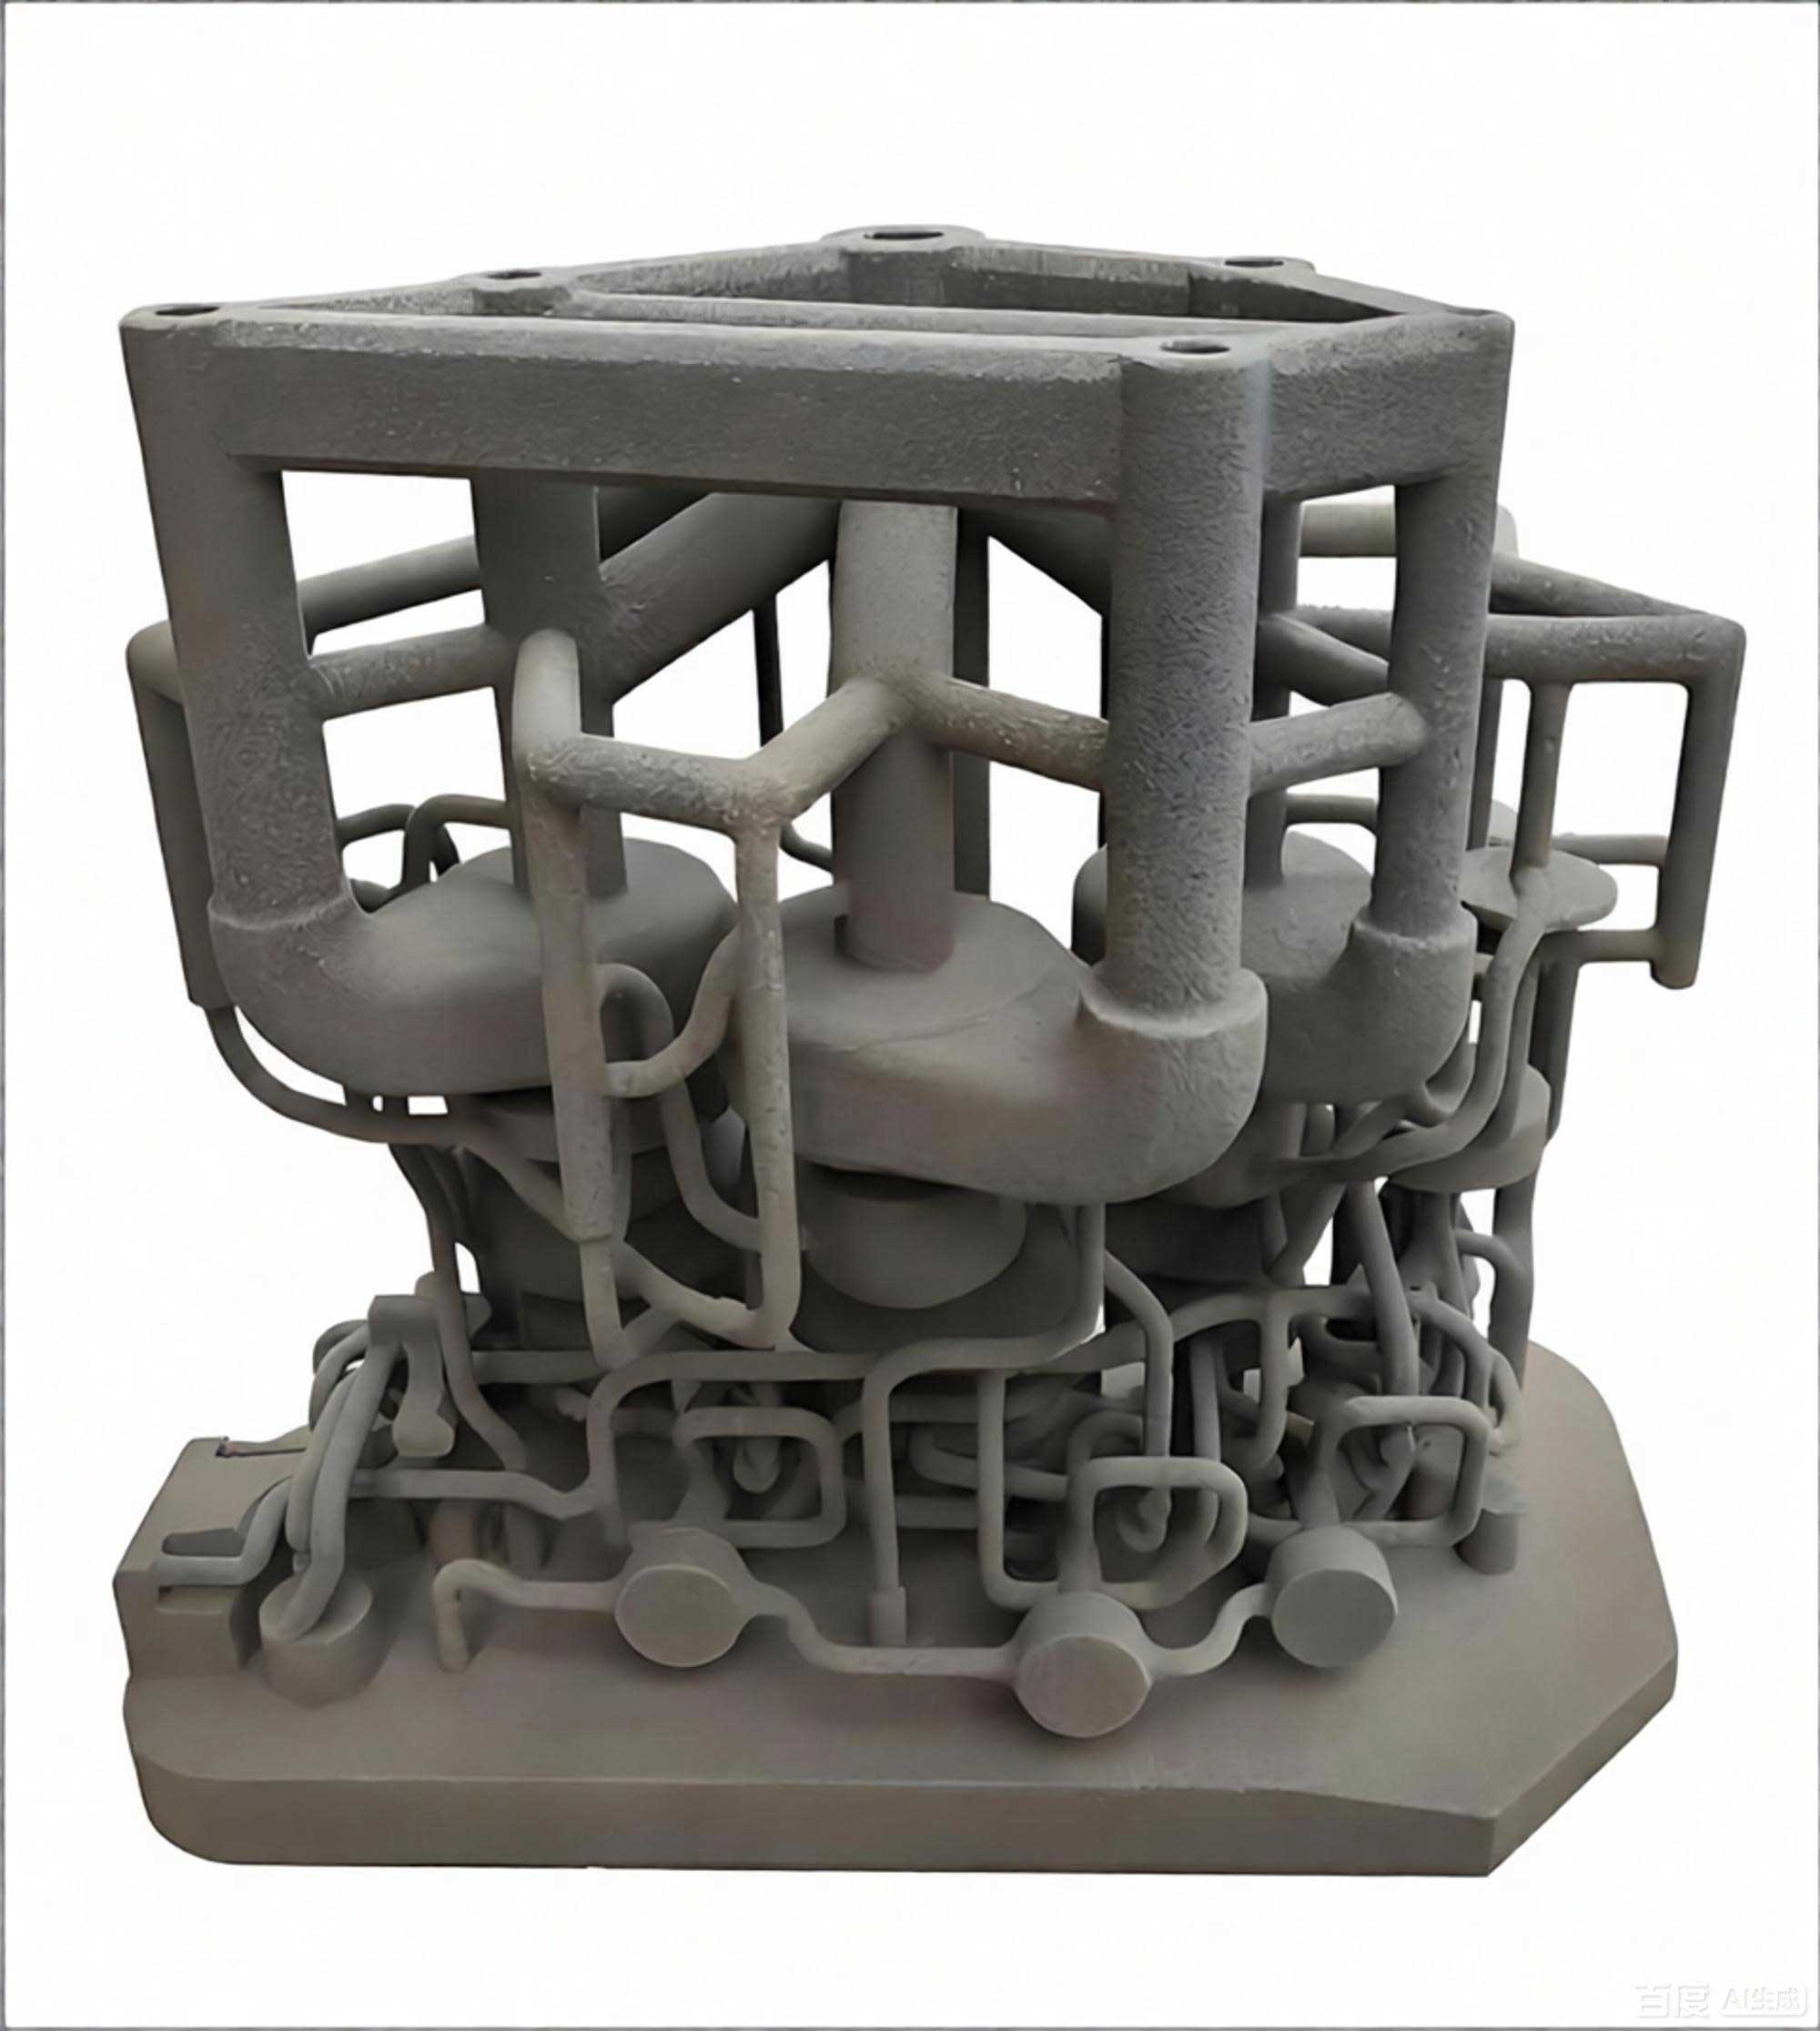
Leveraging the advantages of 3D printing sand casting, a conformal gating system was designed. This approach allows for optimal gating geometry that cannot be achieved with conventional split-pattern tooling. The gating system is based on a bottom-filling, two-layer sprue design for efficient filling and temperature distribution. A stepped sprue system with two horizontal runners was designed to facilitate the upward and progressive filling of the mold cavity. The cross-sectional area ratios of the gating system were designed as:
$$ A_{sprue} : A_{runner} : A_{ingate} = 1:2:4 $$
The ingate area (A_in) was calculated using the “large orifice flow” theory:
$$ A_{in} = \frac{G_L}{\rho_L \cdot \mu \cdot t \cdot \sqrt{2 \cdot g \cdot h_p}} $$
Where G_L is the mass of the molten metal flowing through the final section of the gating system, ρ_L is the density of the melt, μ is the flow loss coefficient, t is the pouring time, g is the gravitational acceleration, and h_p is the effective pressure head for ingate. The effective pressure head is determined by the geometry of the sprue and the mold. Different casting orientations were evaluated, leading to the conclusion that placing the cylinder liners in the lower portion of the mold (inverted casting) offered the best performance for liner bonding and directional solidification.
| Process Plan | Casting Orientation | Total Pouring Weight (kg) | Casting Yield (%) |
|---|---|---|---|
| A | Upright | 46.99 | 38.52 |
| B | Side-lying | 40.86 | 44.30 |
| C | Inverted (Cylinder Liners at Bottom) | 48.17 | 37.58 |
4.2 Simulation Methodology and Governing Equations
Simulation of the casting process was performed using the ProCAST software. Prior to simulation, a finite element mesh was generated. The mesh for the cast part, gating, and chill materials was set to 4 mm, while the sand mold shell was meshed with a 20 mm size. The total mesh count was over 11.7 million elements. The thermal and flow behavior of the molten metal and mold are governed by the fundamental principles of fluid dynamics and heat transfer. For the filling analysis, the simulation solves the continuity, momentum (Navier-Stokes), and energy equations for an incompressible, non-Newtonian fluid.
The continuity equation (mass conservation) is formulated as:
$$ \frac{\partial u}{\partial x} + \frac{\partial v}{\partial y} + \frac{\partial w}{\partial z} = 0 $$
The momentum conservation in three dimensions (Navier-Stokes equations) is given by:
$$ \frac{\partial u}{\partial t} + u \frac{\partial u}{\partial x} + v \frac{\partial u}{\partial y} + w \frac{\partial u}{\partial z} = -\frac{1}{\rho} \frac{\partial p}{\partial x} + g_x + \gamma \left( \frac{\partial^2 u}{\partial x^2} + \frac{\partial^2 u}{\partial y^2} + \frac{\partial^2 u}{\partial z^2} \right) $$
$$ \frac{\partial v}{\partial t} + u \frac{\partial v}{\partial x} + v \frac{\partial v}{\partial y} + w \frac{\partial v}{\partial z} = -\frac{1}{\rho} \frac{\partial p}{\partial y} + g_y + \gamma \left( \frac{\partial^2 v}{\partial x^2} + \frac{\partial^2 v}{\partial y^2} + \frac{\partial^2 v}{\partial z^2} \right) $$
$$ \frac{\partial w}{\partial t} + u \frac{\partial w}{\partial x} + v \frac{\partial w}{\partial y} + w \frac{\partial w}{\partial z} = -\frac{1}{\rho} \frac{\partial p}{\partial z} + g_z + \gamma \left( \frac{\partial^2 w}{\partial x^2} + \frac{\partial^2 w}{\partial y^2} + \frac{\partial^2 w}{\partial z^2} \right) $$
The energy conservation equation, governing the heat transfer during solidification, is expressed as:
$$ \frac{\partial T}{\partial t} + u \frac{\partial T}{\partial x} + v \frac{\partial T}{\partial y} + w \frac{\partial T}{\partial z} = \frac{\lambda}{\rho c} \left( \frac{\partial^2 T}{\partial x^2} + \frac{\partial^2 T}{\partial y^2} + \frac{\partial^2 T}{\partial z^2} \right) + \frac{S}{\rho c} $$
For the prediction of solidification defects like shrinkage porosity and misruns, the porous media and Niyama criteria are commonly used. The Niyama criterion is a valuable indicator for predicting the location of micro-porosity in castings:
$$ NY = \sqrt{\frac{G}{R}} $$
Where G is the temperature gradient and R is the local cooling rate. A smaller NY value indicates a higher tendency for porosity formation. These equations, solved via the finite element method, allow for accurate prediction of the flow field, temperature field, and defect concentration during the entire casting process.
4.3 Simulation Results and Discussion
The simulation results for the three proposed casting processes (A, B, and C) were compared. The key findings for Process C, identified as the optimal process, include:
4.3.1 Filling Analysis
Process C (inverted casting) demonstrated the most efficient and stable filling behavior. The simulation showed that the molten metal enters the casting cavity from the bottom and fills the entire main body of the cylinder block in approximately 10.67 seconds. This rapid and controlled filling helps to avoid turbulent flow and the formation of oxide films. A comparison of the filling times for various processes is shown below.
- A: 11.20 s
- B: Turbulent flow and longer fill time
- C: 10.67 s
4.3.2 Solidification and Defect Analysis
The thermal field analysis for Process C indicated a controlled, directionally solidifying casting with a minimal formation of isolated liquid regions. The subsequent defect analysis predicted a total defect volume of only 0.899 cc, which is remarkably low for a complex casting of this size.
| Process Plan | Total Defect Volume (cc) | Avg. Defect Result (%) | Porosity Volume (cc) |
|---|---|---|---|
| A | 6.391 | 12.503 | 0.913 |
| B | 7.202 | 12.620 | 1.043 |
| C | 7.195 | 11.102 | 0.899 |
Process C exhibited the lowest defect volume and the defects that were predicted appeared in less critical, non-functional areas. Process B was unstable and predicted a large critical shrinkage cavity. This strongly validated the design of the conformal and inverted casting process.
Chapter 5. Rapid Prototyping of Cylinder Block via 3D Printing Sand Casting
5.1 Sand Mold Printing and Post-Processing
Once the optimal casting process was defined and simulation-verified, the entire sand mold assembly was designed for 3D printing. The mold was divided into upper and lower sections for easier handling and assembly. The 3D model was precisely sliced into 1215 layers of 0.5 mm thickness and printed using the PCM-800 printer. The complete set of molds took approximately 10 hours to produce. A critical aspect of the post-processing involved a drying step at 150 ℃ for 2 hours to remove any residual moisture and volatiles from the binder, which is a key factor for preventing gas defects in the final casting.
5.2 Assembly and Casting
The dried sand mold components were then assembled. This included the installation of cast-iron chillers, ceramic foam filters, and the heating elements for the cylinder liners. The cylinder liners were preheated to 400 ℃ using integrated heating rods before pouring to enhance the metallurgical bond between the cast-iron liner and the aluminum alloy. The ZL101A melt was prepared, degassed, modified, and poured at an initial temperature of 730 ℃ with a pouring rate of 3 kg/s. The gravimetric filling process was carried out manually, after which the casting was allowed to solidify and cool.
5.3 Evaluation of the Cast Cylinder Block
The as-cast cylinder block was examined and evaluated according to standard automotive part acceptance criteria. The 3D printing sand casting route enabled the completion of the entire development-to-casting cycle from the design simulation to the final cast component in only 3 to 4 days. This is a paradigm shift compared to the traditional development cycle that typically requires weeks to months for tooling fabrication.
5.3.1 Non-Destructive Testing (NDT)
Non-destructive testing of the cast component was carried out using X-ray inspection (X-Ray) and a pressure leak test. The X-Ray inspection revealed that the cast component was free from significant internal defects such as gross shrinkage cavities and inclusions. The results confirmed the close bonding between the cast-iron cylinder liners and the aluminum matrix, with no visible gaps or discontinuities. The pressure leak test, which was conducted at 0.3 MPa, also confirmed the integrity of the cast component, indicating that the microstructure is free from micro-porosity channels that could lead to leakage in service.
5.3.2 Microstructural Analysis
Metallographic samples were sectioned from key areas of the cylinder block, specifically the main bearing area and the cylinder liner region. The microscopic examination of the liner-matrix interface showed excellent fusion and a uniform diffusion layer with an average penetration depth of 2-3 mm. The microstructure of the cast aluminum alloy was uniform with fine, well-dispersed constituents. X-ray diffraction analysis revealed that the primary α-Al phase and the eutectic silicon were refined and evenly distributed, contributing to the high mechanical properties. Sporadic defects, such as the iron-containing intermetallic phases, were kept to a minimum due to careful control of the melt quality and casting parameters.
5.3.3 Mechanical Properties
The mechanical properties of the cast and T6 heat-treated engine cylinder block were evaluated by testing coupons that were cast integrally with the component. The test results are summarized below, demonstrating that the cast component not only meets but also exceeds the standard specifications.
| Alloy State | Ultimate Tensile Strength (MPa) | Elongation (%) | Hardness (HB) |
|---|---|---|---|
| Standard Value (ZL101A-T6) | > 220 | > 2.0 | 80 |
| Test Value (Cylinder Block) | 278 | 2.3 | 97 |
These results clearly indicate that the 3D printing sand casting process, with its inherent design flexibility and production speed, is a highly suitable and reliable manufacturing method for complex, high-value components such as automotive engine cylinder blocks. The process successfully integrates the advantages of traditional casting materials and performance with the geometric freedom of additive manufacturing.
Conclusions
This research conducted a comprehensive investigation into the application of 3D printing sand casting for complex aluminum alloy components. The key conclusions derived from this work are as follows:
(1) Process Optimization: The performance of 3D printing sand castings is significantly affected by the process parameters. An optimal parameter set for ZL101A castings was identified: a printing layer thickness of 0.5 mm, a printing speed of 25 s/layer, and pouring into a dry, un-preheated mold at 720 ℃. These conditions led to a casting with a density of 2.6503 g/cm³ and a T6 heat-treated tensile strength of 229 MPa with an elongation of 0.5 %.
(2) Mold Comparison: Compared to traditional hand-crafted sand molds, 3D printed sand molds produce castings with superior overall quality, including higher density, fewer defects, and improved and more consistent mechanical properties.
(3) Simulation-Driven Design: The use of ProCAST simulation was critical in designing and validating a conformal, inverted casting process for a complex automotive cylinder block. Simulation results predicted that this optimized process would result in an excellent final cast, with a negligible total defect volume of only 0.899 cc.
(4) Successful Production: The simulation-verified process was successfully translated to actual production using 3D printed sand molds. The resulting engine cylinder block met all acceptance standards. The T6 heat-treated casting exhibited an ultimate tensile strength of 278 MPa, an elongation of 2.3 %, and a hardness of 97 HB, exceeding the standard requirements. The total production cycle time was a mere 3 to 4 days, highlighting the immense potential of this technology for rapid prototyping and low-volume production, offering a significant competitive advantage in the manufacturing industry.