
In my engineering practice, I often encounter challenges in producing critical components via casting methods. One such component is the rump pan, a vital part of the scraper conveyor’s middle trough in mining applications. Its structural integrity, material performance, and surface quality are paramount for operational safety and reliability. Traditional sand casting methods have been employed, but I have increasingly turned to the lost foam casting process due to its distinct advantages. The lost foam casting process offers benefits such as the absence of binders in molding sand, ease of sand reclamation, reduced cleaning effort for castings, no need for cores—making it ideal for complex geometries—simplified production steps, lower cost, higher efficiency, improved surface finish, dimensional accuracy, and better environmental conditions. However, developing a robust lost foam casting process for the rump pan often leads to defects like shrinkage porosity, shrinkage cavities, misruns, and cold shuts. To address these issues, I utilized numerical simulation technology to visualize the casting process, predict potential defects, and optimize the process, thereby enhancing casting quality and shortening development cycles. This article details my investigation into the numerical simulation and process optimization of the lost foam casting process for a cast steel rump pan, focusing on overcoming common quality problems.
The rump pan, often referred to as an E-shaped trough steel, has a complex geometry with significant variation in wall thickness. Its overall dimensions are approximately 1590 mm in length, 370 mm in width, and 285 mm in height. The minimum wall thickness is 25 mm, located at the top section of the M-shaped groove side, while the maximum wall thickness reaches 60 mm, creating pronounced thermal junctions, particularly in the middle of the M-shaped groove and at the base. The casting material is ZG30SiMn steel, with a weight of about 37 kg. Key features include shovel plate sections, thrust lugs with哑铃销孔 at both ends for assembly, and the main body. The M-shaped groove is designed for welding a middle plate and a bottom seal plate, requiring high straightness. Given the casting’s size, preventing deformation is crucial. The M-shaped chute and middle plate serve as primary working surfaces, demanding high strength, toughness, and wear resistance. These requirements make the lost foam casting process a suitable but challenging manufacturing route.
To systematically analyze the lost foam casting process, I employed the InteCAST software (华铸CAE), a specialized tool for casting simulation. The simulation framework involves solving coupled equations for fluid flow, heat transfer, and solidification. The governing equations for the lost foam casting process include the continuity equation, momentum equation (Navier-Stokes), and energy equation. For incompressible flow during mold filling, the continuity equation is:
$$ \nabla \cdot \mathbf{v} = 0 $$
where \(\mathbf{v}\) is the velocity vector. The momentum equation accounts for gravity, pressure, and viscous forces:
$$ \rho \left( \frac{\partial \mathbf{v}}{\partial t} + \mathbf{v} \cdot \nabla \mathbf{v} \right) = -\nabla p + \mu \nabla^2 \mathbf{v} + \rho \mathbf{g} $$
Here, \(\rho\) is density, \(p\) is pressure, \(\mu\) is dynamic viscosity, and \(\mathbf{g}\) is gravitational acceleration. The energy equation for heat transfer during filling and solidification is:
$$ \rho c_p \left( \frac{\partial T}{\partial t} + \mathbf{v} \cdot \nabla T \right) = \nabla \cdot (k \nabla T) + Q $$
where \(T\) is temperature, \(c_p\) is specific heat capacity, \(k\) is thermal conductivity, and \(Q\) represents heat sources, such as latent heat release during solidification. The solidification model incorporates the enthalpy method to track phase change. For the lost foam casting process, additional considerations include the degradation of the foam pattern and gas evolution, which can be modeled via source terms in the equations. However, for simplicity in this study, I focused on the thermal and fluid dynamics aspects, assuming the foam pattern instantaneously decomposes upon contact with molten metal, a common approximation in lost foam casting process simulations.
The material properties and boundary conditions for the simulation are summarized in the following tables. Table 1 lists the thermal properties of ZG30SiMn steel used in the lost foam casting process.
| Property | Value | Unit |
|---|---|---|
| Liquidus Temperature | 1512 | °C |
| Solidus Temperature | 1470 | °C |
| Pouring Temperature | 1600 | °C |
| Density (Liquid) | 7000 | kg/m³ |
| Specific Heat Capacity | 750 | J/(kg·K) |
| Thermal Conductivity | 35 | W/(m·K) |
| Latent Heat of Fusion | 270000 | J/kg |
Table 2 outlines the boundary conditions and process parameters for the lost foam casting process simulation.
| Parameter | Value | Unit |
|---|---|---|
| Environmental Temperature | 25 | °C |
| Interface Heat Transfer Coefficient (Cast/Sand) | 800 | W/(m²·K) |
| External Heat Transfer Coefficient (Sand/Air) | 10 | W/(m²·K) |
| Pouring Time | 30 | s |
| Vacuum Pressure | -0.06 | MPa |
Based on the rump pan’s geometry, I initially designed a top-gating system for the lost foam casting process. The casting orientation was set with the M-groove facing downward, and the gating system consisted of a pouring cup, a sprue, and an ingate, without a runner to simplify the lost foam casting process. The ingate had a diameter of 50 mm, and the sprue diameter was 60 mm. A riser was placed at the opposite end of the ingate to aid feeding. During mold assembly, the pattern was tilted approximately 3° to facilitate sand filling and compaction, as well as to improve riser feeding. This initial design is depicted schematically, though no images are referenced here per the instructions.
The simulation of the initial lost foam casting process revealed critical insights. The filling process was simulated stepwise. At 10% filling, molten metal entered through the gating system and began filling the top of the M-groove. The metal-foam interaction caused gasification, leading to temperature drops at the flow front. By 40% filling, the M-groove was largely filled. At 60%, metal started filling the thick shovel plate section, but significant temperature gradients were observed between the ingate side and the opposite side ribs and base. At 80%, the thick plate section was mostly filled, and at 100%, the riser was filled. The filling process was somewhat turbulent due to gas interference, which is typical in the lost foam casting process.
The solidification simulation for the initial lost foam casting process indicated problematic areas. The temperature field evolution showed that the bottom of the M-groove and the periphery of the shovel plate solidified first. At approximately 338.9 seconds, these areas were fully solid, while the central part of the shovel plate and ribs remained liquid. By 881.4 seconds, only a central bar-like region in the shovel plate was liquid, but the riser neck had already solidified, cutting off feeding. Complete solidification occurred around 2545.9 seconds. The shrinkage porosity prediction, based on the Niyama criterion or similar methods, can be expressed as:
$$ G / \sqrt{R} \leq C $$
where \(G\) is the temperature gradient, \(R\) is the cooling rate, and \(C\) is a critical value. Regions with low \(G / \sqrt{R}\) are prone to shrinkage porosity. The simulation predicted that shrinkage defects were concentrated at the connection between the shovel plate and the M-groove, especially at the junctions of the shovel plate base and ribs. Additionally, shrinkage cavities were likely in the thick sections of the ribs and thrust lugs. These defects could compromise the component’s load-bearing capacity, leading to potential failure during service.
To optimize the lost foam casting process, I revised the casting orientation and gating design. The new orientation placed the shovel plate with reinforcing ribs facing upward and the M-groove工作面 in a vertical position. This change aimed to promote directional solidification toward the risers. Two risers were added at both ends of the casting to address thermal hotspots at the thrust lugs, with one riser serving as the sprue. The gating system remained a top-gate design but with modified ingate positions to ensure smoother filling. The optimized lost foam casting process layout aimed to enhance feeding and reduce temperature gradients.
The simulation of the optimized lost foam casting process showed marked improvements. During filling, metal first entered the bottom of the M-groove, progressing steadily. By 40% filling, the M-groove middle plate side was filled, and by 60%, the M-groove was complete. At 80%, the thick shovel plate was largely filled, and at 100%, the risers and sprue were full. The temperature distribution was more uniform, with no severe cold spots, indicating a stable lost foam casting process. The solidification analysis revealed that the thrust lug areas, M-groove top, and shovel plate periphery solidified first. At 760.2 seconds, these regions were solid, while the central shovel plate and ribs remained liquid, with the risers and sprue actively feeding. By 1302 seconds, liquid was confined to the risers, sprue, and adjacent plate areas. Complete solidification occurred at 2591.6 seconds. The feeding effect was significantly better, with minimal shrinkage porosity predicted. Only minor porosity was indicated at the shovel plate-M-groove junction and the M-groove middle凸起部位, which could be mitigated by post-welding repair. The optimization effectively reduced defect risks in the lost foam casting process.
The comparative analysis between the initial and optimized lost foam casting process is summarized in Table 3. This table highlights key metrics that demonstrate the effectiveness of the optimization.
| Metric | Initial Lost Foam Casting Process | Optimized Lost Foam Casting Process |
|---|---|---|
| Filling Stability | Moderate, with turbulence and temperature gradients | High, with uniform flow and minimal gradients |
| Solidification Time (s) | ~2545.9 | ~2591.6 |
| Shrinkage Porosity Severity | High in shovel plate base, ribs, thrust lugs | Low, limited to minor areas |
| Feeding Effectiveness | Poor, riser neck sealed early | Excellent, risers fed until late solidification |
| Predicted Defects | Shrinkage cavities and porosity likely | Negligible major defects |
The improvement can be quantified using a feeding efficiency parameter \(\eta\), defined as the ratio of volume fed by risers to the total shrinkage volume:
$$ \eta = \frac{V_{\text{fed}}}{V_{\text{shrinkage}}} $$
For the optimized lost foam casting process, \(\eta\) approaches 1, indicating efficient feeding, whereas for the initial process, \(\eta < 1\), leading to defects. Additionally, the temperature gradient \(G\) and cooling rate \(R\) were more favorable in the optimized scheme. For instance, at the critical shovel plate base, \(G\) increased from 2.5 K/mm to 4.0 K/mm, and \(R\) decreased from 0.8 K/s to 0.5 K/s, enhancing the \(G / \sqrt{R}\) ratio above the critical threshold.
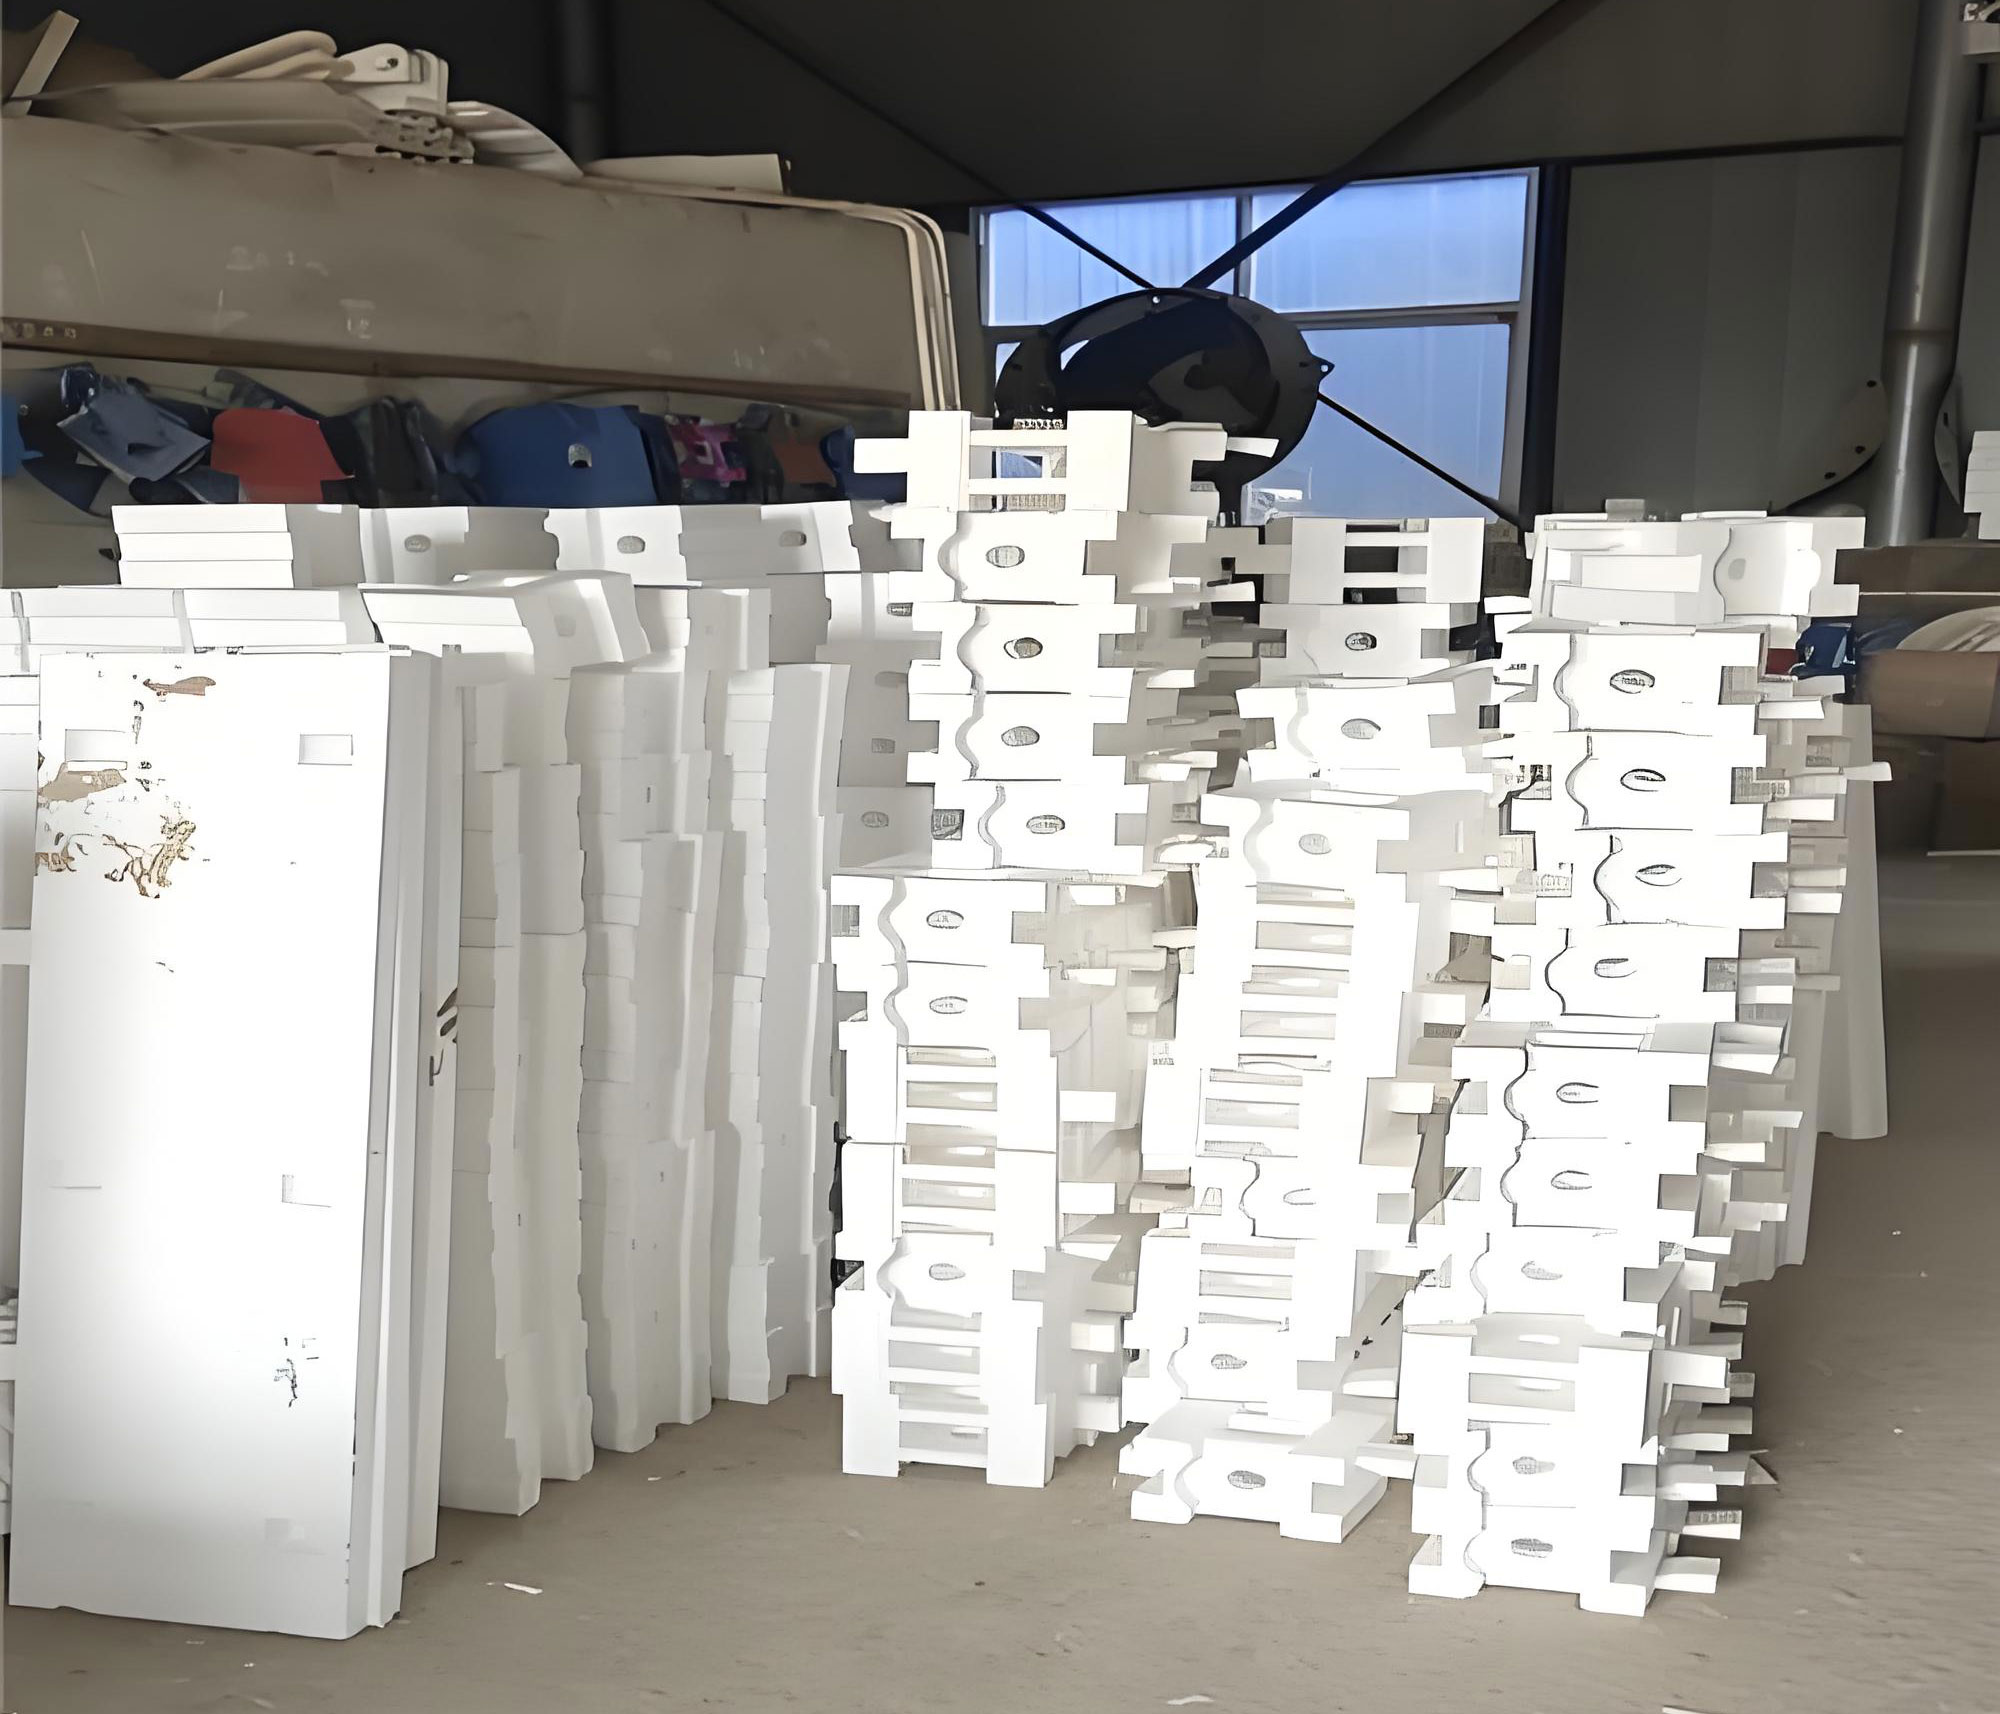
To validate the optimized lost foam casting process, I oversaw its implementation in batch production. EPS patterns were manufactured according to the design, and castings were produced under controlled conditions. The lost foam casting process parameters matched those used in simulation: pouring temperature of 1600°C, pouring time of 30 s, and vacuum pressure of -0.06 MPa. After casting, the rump pans were inspected visually and via sectioning. The results confirmed the absence of significant shrinkage cavities, porosity, gas holes, or misruns. The castings exhibited good surface quality and dimensional accuracy, meeting the stringent requirements for mining equipment. Subsequent heat treatment and welding assembly further validated their performance in service. This practical success underscores the reliability of numerical simulation in optimizing the lost foam casting process.
Beyond this specific case, the lost foam casting process presents general challenges that simulation can address. For example, foam degradation kinetics can be modeled more accurately by incorporating gas evolution equations. The rate of foam decomposition can be expressed as:
$$ \frac{dm_f}{dt} = -k_f A (T – T_d) $$
where \(m_f\) is foam mass, \(k_f\) is a degradation rate constant, \(A\) is contact area, \(T\) is metal temperature, and \(T_d\) is decomposition temperature. Integrating such models could refine simulations for complex lost foam casting process applications. Additionally, mold compaction and sand properties affect heat transfer; variations can be studied using stochastic simulations to ensure robustness.
In conclusion, my investigation demonstrates the power of numerical simulation in refining the lost foam casting process for complex components like the rump pan. The initial lost foam casting process design led to predictable defects due to unfavorable solidification patterns. By reorienting the casting and modifying the gating system, the optimized lost foam casting process achieved stable filling and effective feeding, virtually eliminating shrinkage defects. The simulation results were corroborated by successful batch production, highlighting the method’s efficacy. This approach can be extended to other components in the lost foam casting process, contributing to improved quality and efficiency in casting manufacturing. Future work may involve integrating advanced models for foam behavior and conducting multi-objective optimization to balance quality, yield, and cost in the lost foam casting process.
To further elaborate on the technical aspects, I can discuss the role of vacuum pressure in the lost foam casting process. The applied vacuum helps remove degradation gases and stabilizes the mold, influencing fluid flow and heat transfer. The pressure difference \(\Delta P\) between the mold cavity and environment affects the metal flow velocity \(v\) according to Bernoulli’s principle modified for porous media:
$$ \frac{P}{\rho} + \frac{v^2}{2} + gh + \frac{\mu}{\rho} \int \nabla^2 v \, dl = \text{constant} – \Delta P_{\text{vacuum}} $$
where \(h\) is height. Optimizing \(\Delta P\) is crucial for minimizing turbulence in the lost foam casting process. Moreover, the choice of coating thickness on the foam pattern impacts interfacial heat transfer. A thicker coating increases thermal resistance, slowing cooling, which can be modeled via an effective heat transfer coefficient \(h_{\text{eff}}\):
$$ \frac{1}{h_{\text{eff}}} = \frac{1}{h_c} + \frac{\delta}{k_c} $$
where \(h_c\) is the coating-metal coefficient, \(\delta\) is coating thickness, and \(k_c\) is coating thermal conductivity. These parameters can be tuned in simulation to match real-world lost foam casting process conditions.
Finally, I present Table 4 summarizing key recommendations for implementing a successful lost foam casting process based on this study. These guidelines can help engineers avoid common pitfalls.
| Aspect | Recommendation for Lost Foam Casting Process |
|---|---|
| Casting Orientation | Orient to promote directional solidification toward risers; place thick sections upward. |
| Gating Design | Use top-gating with simple sprue-ingate systems; avoid runners to reduce gas entrapment. |
| Riser Placement | Position risers at thermal hotspots; ensure adequate neck size to delay sealing. |
| Simulation Parameters | Calibrate heat transfer coefficients and include foam degradation effects for accuracy. |
| Process Control | Maintain consistent pouring temperature, time, and vacuum pressure. |
| Pattern Design | Ensure uniform coating application and proper compaction of sand around the pattern. |
Through this comprehensive analysis, I have shown that the lost foam casting process, when coupled with numerical simulation, is a powerful method for producing high-integrity castings. The iterative design and optimization process, centered on the lost foam casting process, led to a robust solution for the rump pan, and similar methodologies can be applied across industries to enhance casting quality and efficiency.