
Lost foam casting has been widely recognized in the foundry industry as one of the most promising near-net-shape manufacturing technologies. In my research, I focus on a critical and persistent defect in iron castings produced by this process: the carbon defect. This paper presents my systematic investigation into the formation mechanisms, influencing factors, and prevention strategies for carbon defects in lost foam castings. I begin by introducing the fundamental principles of lost foam casting and its advantages, then present a detailed characterization of carbon defects using advanced analytical techniques. I describe a series of controlled experiments designed to isolate the effects of pattern material, pattern density, pouring temperature, coating properties, sand properties, and vacuum negative pressure. Based on these experiments, I develop a comprehensive understanding of the carbon defect formation mechanism and propose practical countermeasures that have proven effective in my production practice. My work demonstrates that carbon defects in lost foam castings arise primarily from the thermal decomposition products of the foam pattern, and that their formation is governed by the competing processes of decomposition product generation and evacuation. Through careful optimization of process parameters, the incidence of carbon defects can be dramatically reduced.
1. Introduction
Lost foam casting is a relatively modern casting process that differs fundamentally from conventional sand casting. The process begins with the production of a foam pattern made from expandable polystyrene or its copolymers. This pattern is an exact replica of the desired casting, including gates, risers, and runners. After the pattern is coated with a refractory coating and dried, it is embedded in unbonded dry sand, which is compacted by vibration. When molten metal is poured into the mold, the high temperature causes the foam pattern to decompose and gasify, and the metal progressively replaces the pattern, forming the casting. The fundamental principle of this process is illustrated in Figure 1, which has been adapted from the original research documentation.
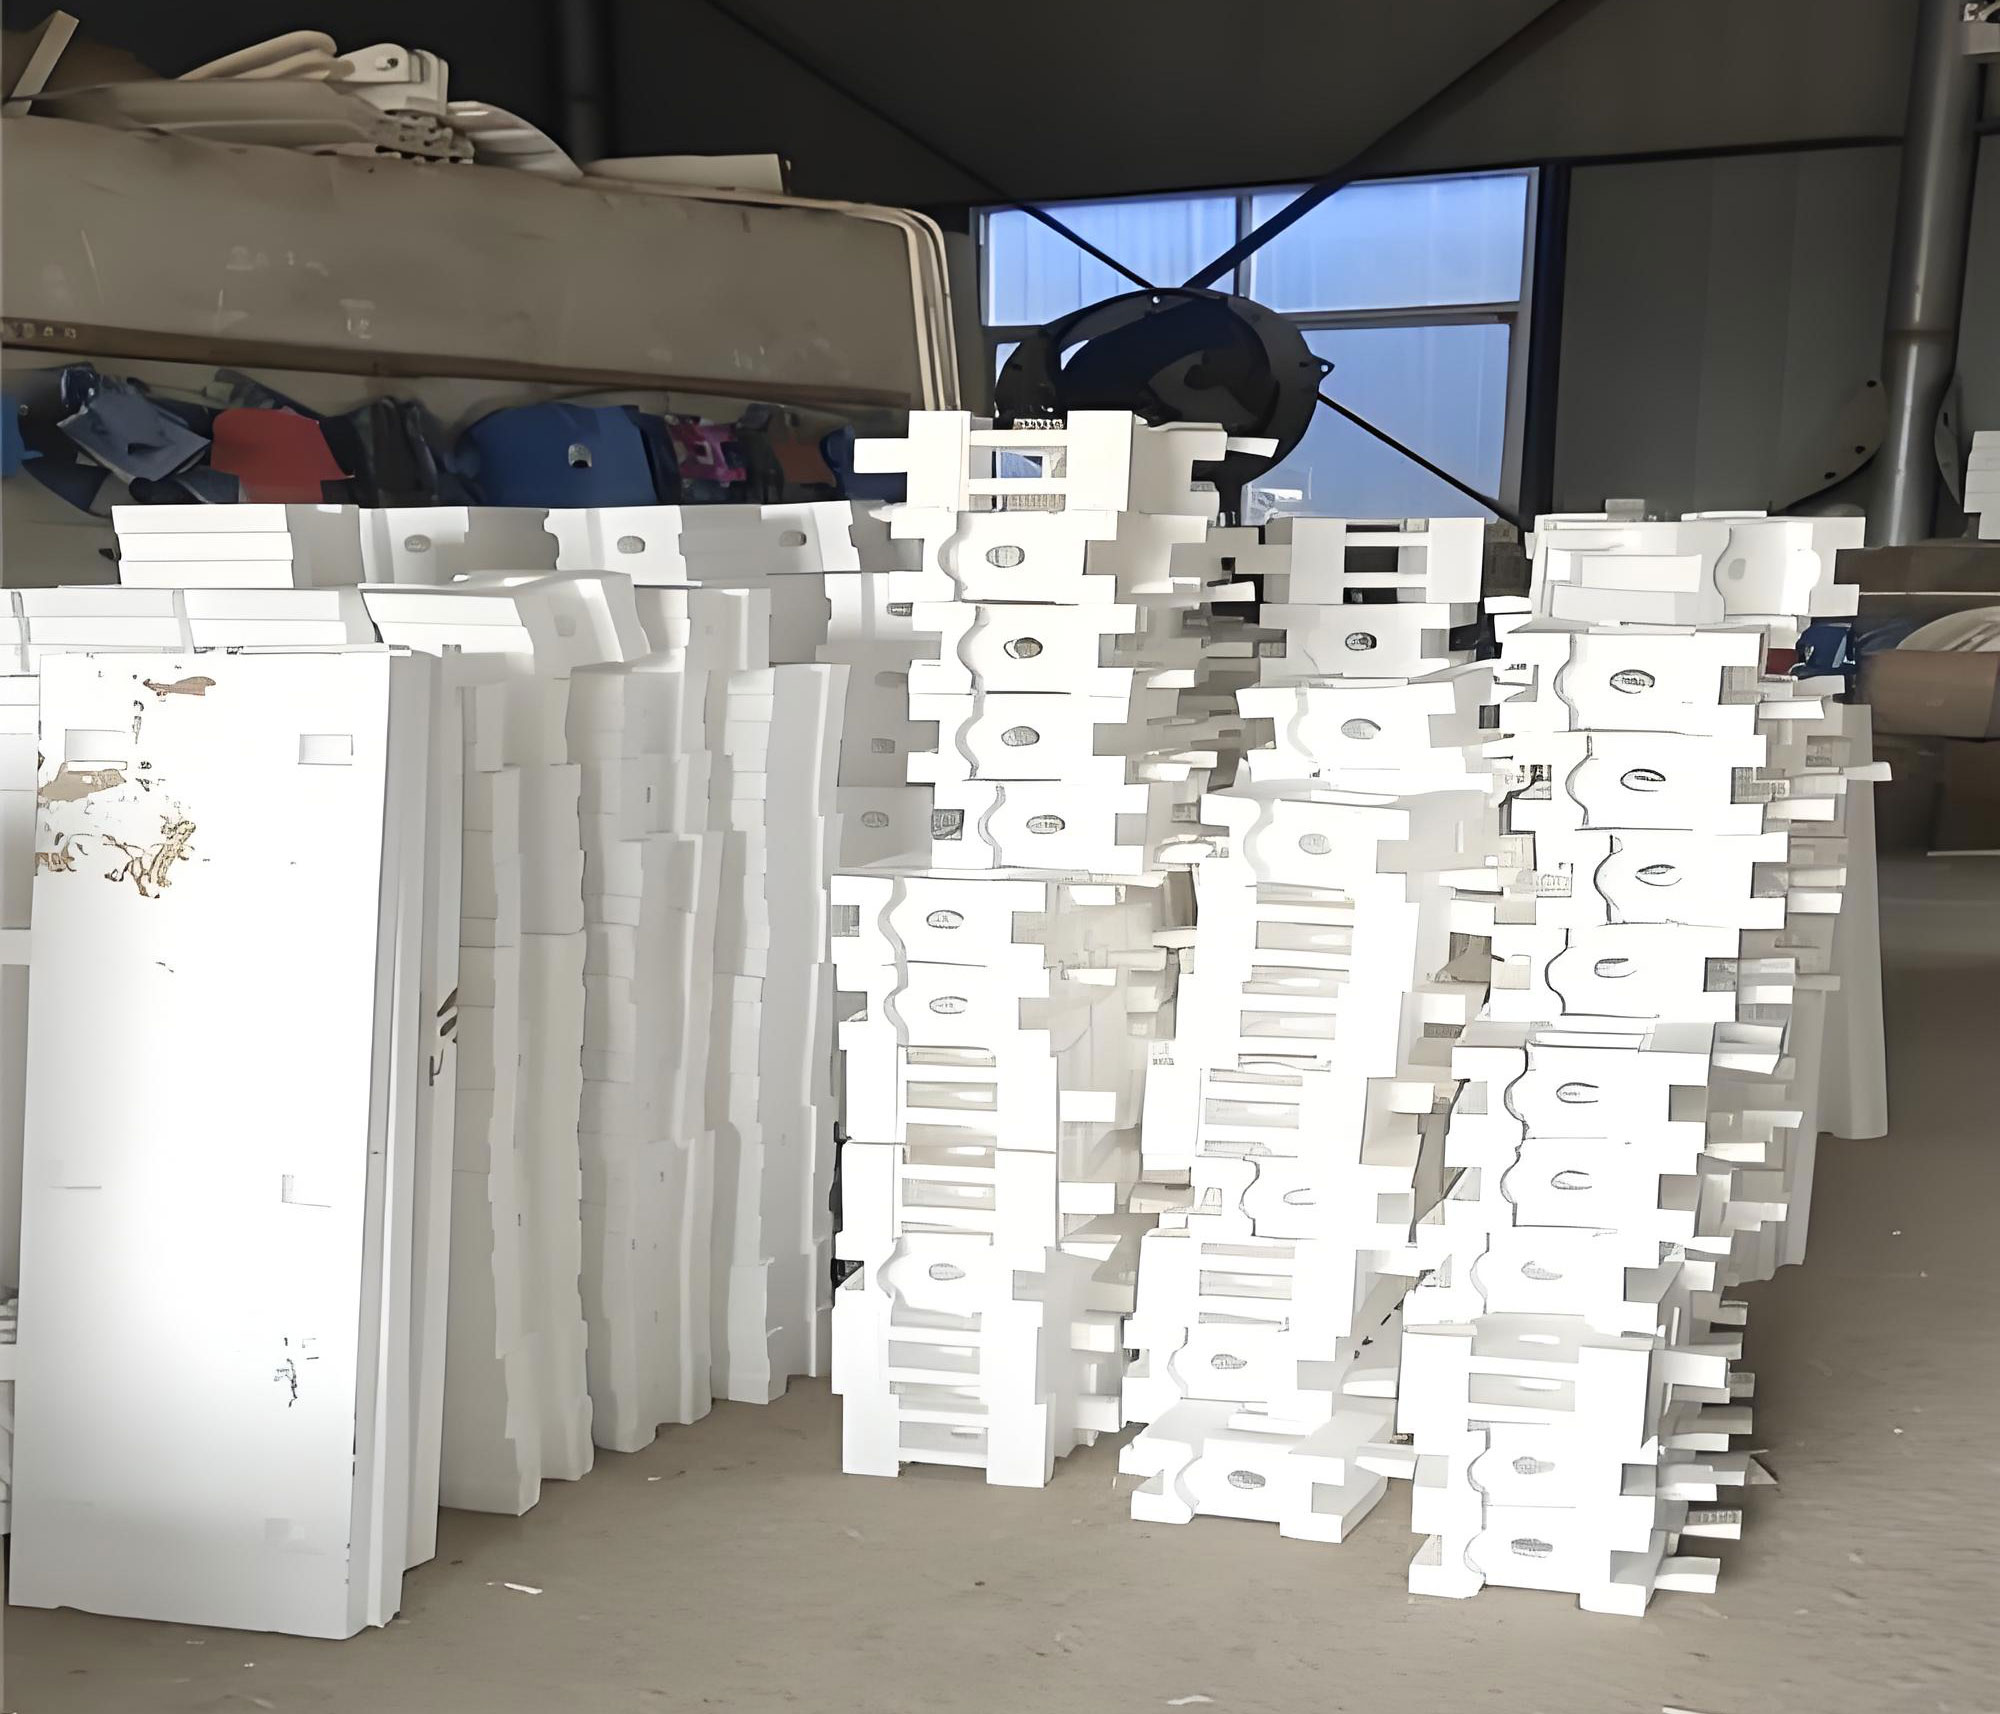
Compared with conventional casting methods, lost foam casting offers several distinct advantages. The process eliminates the need for pattern withdrawal, core assembly, and parting lines, which results in high dimensional accuracy and minimal surface roughness. In my measurements of cast iron transmission housings, I achieved dimensional tolerances of CT7–CT9 and surface roughness values of Ra 6.3–12.5 μm, approaching the level of investment casting. The process also provides greater design freedom, as complex internal cavities can be produced without cores. Additionally, lost foam casting is an environmentally friendly process: the dry sand requires no binders, the foam pattern is harmless at room temperature, and spent sand can be recycled at rates exceeding 95%.
In terms of economics, lost foam casting reduces equipment investment by approximately 40% to 60% compared with conventional molding lines. The higher dimensional accuracy means less machining allowance and shorter machining cycles, resulting in lower overall production costs. I have compared the machining time for a transmission housing produced by resin sand casting and lost foam casting, and the results show that the lost foam casting requires approximately 25% less machining time, as shown in Table 1.
| Parameter | Resin Sand Casting | Lost Foam Casting |
|---|---|---|
| Net weight (kg) | 108 | 105 |
| Machined weight (kg) | 92 | 92 |
| Machining time, vertical lathe (min) | 45 | 30 |
| Machining time, first machining center (min) | 85 | 65 |
| Machining time, second machining center (min) | 75 | 55 |
Despite these advantages, lost foam casting has a unique and serious defect that I have found to be the most challenging problem in production: the carbon defect. This defect appears as black, carbonaceous inclusions on the surface or internal sections of iron castings. Through my statistical analysis of scrap data from a lost foam production workshop over a six-month period, I discovered that carbon defects account for as much as 31% of all defective castings, making them the dominant cause of rejection. The carbon defect is particularly severe in cast iron components, where the high carbon content of the alloy interacts unfavorably with the decomposition products of the polystyrene pattern.
The carbon defect has become a bottleneck restricting the development and widespread adoption of lost foam casting technology, especially in China where the quality of raw materials such as beads and coatings is often inferior to their international counterparts. My research aims to provide a comprehensive understanding of carbon defect formation, quantify the influence of key process parameters, and propose practical solutions that can be implemented in production environments.
2. Characterization of Carbon Defects in Lost Foam Castings
Before investigating the causes of carbon defects, I first conducted a systematic characterization of the defect using a combination of macroscopic examination, optical microscopy, scanning electron microscopy, energy dispersive spectroscopy, and chemical analysis. This analytical work allowed me to establish the composition, morphology, and distribution features of carbon defects in lost foam castings.
2.1 Macroscopic and Microscopic Features
When I sectioned castings containing carbon defects, I observed that the defects appeared as black inclusions with a clustered or lump-like distribution. These inclusions had a clear curved boundary with the surrounding normal metal structure. In transverse cross-sections, the carbon-rich regions were distributed at varying depths below the casting surface, ranging from near-surface to depths exceeding 10 mm.
Under the optical microscope at 100× magnification, the normal regions of the casting displayed uniformly distributed type A graphite, whereas the defect regions exhibited large, massive cluster-type graphite that occupied a significant fraction of the viewing field. The graphite in the boundary region of the defect appeared fragmented and had a broken, abnormal morphology. This observation suggested that the carbon defect represented a localized carbon contamination that dramatically altered the solidification structure of the iron.
Scanning electron microscopy at 1,000× magnification further distinguished the defect region from the normal matrix. In the normal region, I could clearly resolve the metal crystal grains and grain boundaries. In contrast, the defect region showed no discernible metallic grain structure; instead, it exhibited a featureless carbon-rich mass. Energy dispersive spectroscopy performed along a line scan across the defect interface revealed that the carbon concentration fluctuated significantly, with the carbon-rich regions showing dramatically elevated carbon levels.
2.2 Chemical Composition of Carbon Defects
To quantify the chemical composition of the carbon defect, I used a wavelength dispersive spectrometer to analyze both the defect region and the adjacent normal material. Table 2 presents the chemical composition results that I obtained. The defect center region contained over 85% carbon by mass, with additional impurities including silicon, sulfur, and calcium. Importantly, I did not detect significant oxygen in the defect, which excluded oxidation as the primary formation mechanism. The presence of alumina in the defect suggested that the coating may have contributed to the defect through a chemical interaction with the iron.
| Element | Normal region (%) | Defect periphery (%) | Defect center (%) |
|---|---|---|---|
| C | 3.10 | 62.5 | 85.6 |
| Si | 2.15 | 2.30 | 1.85 |
| Mn | 0.62 | 0.55 | 0.48 |
| P | 0.041 | 0.038 | 0.042 |
| S | 0.032 | 2.40 | 3.20 |
| Fe | 94.06 | 30.5 | 5.2 |
| Al | — | 0.75 | 1.25 |
| Ca | — | 0.62 | 1.40 |
This compositional analysis confirmed that the carbon defect is primarily a carbonaceous material. The carbon originates from the thermal decomposition of the foam pattern material, which in the oxygen-starved environment near the metal front converts into a tar-like liquid and eventually solid carbon. The high sulfur content detected in the defect periphery suggested that the liquid decomposition products preferentially absorbed sulfur from the molten iron.
2.3 Locations of Carbon Defects
Through my extensive inspection of production castings, I established that carbon defects in lost foam castings tend to occur at specific locations. First, they occur at the upper surfaces of the casting in the pouring position, where the last-filled regions of the mold accumulate the decomposition products. Second, they occur at the final solidification zones of the casting, which are typically the thermal centers. Third, they frequently appear at the junction of the gating system and the casting, where the metal flow pattern creates stagnant zones. Internally distributed carbon defects tend to be more dispersed and show less consistent patterns; I found that these internal defects correlate strongly with the vacuum negative pressure applied during pouring.
2.4 Influence of Carbon Defects on Casting Performance
Carbon defects have a severe detrimental effect on the mechanical properties and service performance of lost foam castings. I prepared standardized tensile test bars from patterns made of different materials and poured them under controlled conditions. The chemical composition of these test bars is presented in Table 3. When I tested the bars that contained visible carbon defects, I found that their tensile strength was reduced by as much as 18% compared with defect-free bars, as shown in Table 4.
| Element | Content (%) |
|---|---|
| C | 3.45 |
| Si | 2.05 |
| Mn | 0.58 |
| P | 0.036 |
| S | 0.030 |
| Cu | 0.20 |
| Bar No. | Tensile strength (MPa) | Fracture description |
|---|---|---|
| 1 | 245 | No defect |
| 2 | 250 | No defect |
| 3 | 248 | No defect |
| 4 | 202 | Severe carbon black |
| 5 | 225 | Light carbon black |
| 6 | 208 | Severe carbon black |
I also measured the Brinell hardness of both carbon-defected and normal regions on the same casting. The hardness values in the defect regions were significantly lower, as shown in Table 5, which indicates that carbon defects reduce the local mechanical strength of the casting. This reduction in hardness in the carbon-rich areas would compromise the wear resistance of the component surface and could lead to premature failure under cyclic loading.
| Measurement location | Carbon defect region (HB) | Normal region (HB) |
|---|---|---|
| Point 1 | 158 | 197 |
| Point 2 | 162 | 199 |
| Point 3 | 155 | 196 |
The most insidious consequence of carbon defects that I observed is the detrimental effect on pressure tightness. In my leak tests, I selected four castings with varying degrees of carbon defects and soaked them in kerosene for two hours. Two of the castings showed visible kerosene seepage on the opposite side of the wall, indicating that the carbon defect had created continuous or interconnected channels through the casting wall. When I sectioned the other two castings that did not leak, I found that the carbon defect depth was less than 5 mm. This finding demonstrates that the carbon defect can seriously compromise the pressure tightness of hydraulic components and valve bodies, leading to leakage under service pressure.
Furthermore, carbon defects have a significant effect on machining operations. I measured the machining time for castings with and without carbon defects and found that the presence of carbon defects increased machining time by 20% to 30%, primarily because of tool wear and the need for repeated cutting passes to achieve the required surface finish. In some severe cases, the machining of threaded holes in carbon-defected regions resulted in torn threads and scrapped parts.
3. Experimental Investigation of Carbon Defects
To quantitatively determine the influence of various process parameters on carbon defect formation in lost foam castings, I designed and conducted a comprehensive series of experiments. In this section, I describe the experimental equipment, materials, and test matrix used in this investigation.
3.1 Experimental Equipment and Instrumentation
The experimental work was carried out using a combination of production-scale and laboratory-scale equipment. The key equipment included a pre-expander and molding machine for producing foam patterns, a bonding machine for assembling pattern clusters, and a vibration compaction table for molding unbonded sand. I used an induction melting furnace with a capacity of 1.5 tons for melting the iron. The mold boxes were fabricated in-house and had dimensions of 1,500 mm × 1,200 mm × 800 mm. A two-stage vacuum pump system was used to apply negative pressure during pouring.
For analytical characterization, I used a Baird emission spectrometer for chemical analysis, a universal material testing machine for tensile tests, a Brinell hardness tester, a gas evolution tester for measuring coating gas evolution, and an X-ray fluorescence spectrometer for quantitative elemental analysis. Scanning electron microscopy and energy dispersive spectroscopy were performed at a university central analytical facility.
3.2 Target Component
The standard test component in this study was a forklift transmission housing identified as the 30-type liquid force gearbox housing. This component was selected because it represents a typical complex iron casting with demanding quality requirements. It is machined extensively in CNC machining centers and has over a hundred dimensional requirements on all six faces. The bearing bores in particular must be free of any inclusions to prevent oil leakage. The main parameters of this component are summarized in Table 6.
| Property | Value |
|---|---|
| Material grade | HT300 |
| Overall dimensions (mm) | 550 × 420 × 280 |
| Casting weight (kg) | 105 |
| Main wall thickness (mm) | 12 |
| Minimum wall thickness (mm) | 8 |
3.3 Raw Materials
The foam pattern materials used in this study included three types: Chinese-made expandable polystyrene beads (designated EPS-C), Japanese-made expandable polystyrene beads (designated EPS-J), and a copolymer of polystyrene and polymethyl methacrylate (designated EPS/PMMA). The expandable poly (methyl methacrylate) beads, designated EPMMA, were also tested for comparison. Table 7 summarizes the basic properties of these bead types.
| Property | EPS | EPMMA |
|---|---|---|
| Carbon content (%) | 92.3 | 60.0 |
| Heat capacity (kJ·kg⁻¹·K⁻¹) | 1.36 | 1.39 |
| Decomposition heat (J·g⁻¹) | 810 | 485 |
| Glass transition temperature (°C) | 95 | 105 |
| Initial gasification temperature (°C) | 260 | 210 |
| Massive gasification temperature (°C) | 390 | 340 |
| Final gasification temperature (°C) | 480 | 390 |
For the coating, I used three types of refractory coatings: an American coating (Ashland), a German coating, and a coating developed jointly by my institution. Table 8 lists the measured properties of these coatings, including their permeability and gas evolution characteristics.
| Coating type | Strength | Permeability | Density | Gas evolution | |
|---|---|---|---|---|---|
| Room temp. (MPa) | 1000°C (MPa) | Room temp. | 1000°C | 1000°C (mL·g⁻¹) | |
| German coating | 2.25 | 1.10 | 0.55 | 1.40 | 22 |
| American coating (Ashland) | 2.80 | 1.20 | 0.50 | 1.55 | 32 |
| Tsinghua coating | 2.05 | 1.05 | 0.58 | 1.45 | 28 |
The bonding adhesive used for assembling foam patterns was a German cold adhesive and a hot-melt adhesive. The cold adhesive was used to bond the pattern segments together, and the hot-melt adhesive was used to attach the gating system. Table 9 presents the gas evolution characteristics of these adhesives.
| Adhesive type | Gas evolution (mL·g⁻¹) | Gas evolution rate | Ignition residue (%) |
|---|---|---|---|
| Cold adhesive | 140 | Medium | 8.5 |
| Hot-melt adhesive | 210 | High | 5.2 |
3.4 Experimental Design
I designed a series of controlled experiments to isolate the effect of individual process parameters. The parameters investigated included the pattern material, pattern density, pouring temperature, coating type, sand grain size, and vacuum negative pressure. In each set of experiments, I varied only the parameter of interest while holding all other conditions constant. The number of test castings per condition varied from three to twelve to ensure statistical reliability.
For studying the influence of pattern material, I produced transmission housings from three types of foam patterns: EPS-C, EPS-J, and a 50:50 blend of EPS-J and EPS-C. All patterns had similar density. The castings were poured at 1,400°C with a coating thickness of 0.6 mm, and the vacuum negative pressure was set at 0.05 MPa.
For studying pattern density, I produced patterns with nominal densities ranging from 15 kg/m³ to 40 kg/m³. A series of pouring trials was then conducted under identical conditions to determine how the density of the pattern influences the amount of decomposition products and hence the severity of carbon defects.
The pouring temperature experiments were conducted at five different temperatures: 1,320°C, 1,360°C, 1,400°C, 1,440°C, and 1,480°C. Each temperature group consisted of five castings, and the defect rate and defect severity were recorded after casting, machining, and sectioning.
For the coating experiments, three different coatings were applied to identical pattern groups. The coating slurry was prepared to a Baume degree of 60–65 with a density of 1.35–1.45 g/cm³, and stirred for four hours prior to application. All other process parameters were kept constant.
For the sand experiments, I used three different sieve fractions: 20–40 mesh, 40–70 mesh, and 70–100 mesh quartz sand from Pingtan, Fujian, with a silicon dioxide content of 95%. Each sand fraction group consisted of ten castings.
Finally, the vacuum negative pressure experiments were conducted at pressures of 0, 0.02, 0.04, 0.05, 0.06, and 0.08 MPa, with all other parameters held constant.
4. Analysis of Key Factors Influencing Carbon Defect Formation
4.1 Mechanism of Carbon Defect Formation
Based on my experimental observations and analysis, I propose the following mechanism for carbon defect formation in lost foam castings. When molten iron at temperatures of 1,360–1,480°C contacts the foam pattern, the pattern undergoes rapid thermal decomposition. The decomposition process produces a mixture of gas-phase, liquid-phase, and solid-phase products. The gas-phase products consist of small-molecule gases such as methane, ethylene, acetylene, hydrogen, and carbon monoxide, along with volatile aromatic compounds such as benzene, toluene, and styrene. The liquid-phase products are composed of low-molecular-weight polystyrene fragments that exist as a tar-like viscous liquid. The solid products are carbon black particles
The key to understanding carbon defect formation lies in the competition between the rate of decomposition product generation and the rate of product evacuation from the mold cavity. When the metal filling velocity exceeds the rate at which decomposition products can gasify and escape through the coating and sand, a pool of liquid decomposition products accumulates at the metal front. This viscous liquid is pushed by the advancing metal to the side surfaces and the last-filled regions of the casting. Under the sustained high temperature, this liquid material undergoes further thermal cracking in an oxygen-deficient environment, eventually converting into solid carbon deposits. These deposits remain in the casting after solidification and appear as carbon defects.
The formation process can be represented by the following sequence. The foam pattern first softens and melts upon contact with the advancing metal front, forming a liquid film. This liquid film then partially vaporizes to form gas bubbles, while the remaining portion decomposes into a residual carbon-rich solid. The carbon-rich residue can be described by:
$$ \text{Polystyrene} \xrightarrow{\Delta T} \text{Gas products} + \text{Liquid tar} + \text{Solid carbon} $$
The abundance of each product depends strongly on temperature, heating rate, and the chemical structure of the polymer. For polystyrene, which contains a thermodynamically stable benzene ring structure, the decomposition is a random chain scission process that produces a significant fraction of liquid residues. In contrast, poly(methyl methacrylate), which lacks benzene rings, decomposes by a “unzipping” mechanism that produces predominantly gas-phase monomer, leaving very little liquid residue.
4.2 Effect of Pattern Material Composition
I observed that the pattern material is the most fundamental factor influencing carbon defect formation. The experimental results comparing different pattern materials are presented in Table 10. The castings produced from the EPS-C pattern exhibited severe carbon defects with filling times nearly double those of the EPS-J patterns. The EPS-J patterns produced castings with no visible carbon defects and significantly faster filling times. The blended material produced intermediate results with only minor point-like carbon defects.
| Pattern No. | Material | Filling time (s) | Carbon defect severity |
|---|---|---|---|
| 1 | EPS-C (Chinese) | 78 | Severe |
| 2 | EPS-J (Japanese) | 36 | No visible defect |
| 3 | 50% EPS-J + 50% EPS-C | 52 | Point-like defects |
This behavior can be understood by examining the chemical structure of the two polymers. Polystyrene has the molecular formula $[CH_2CH(C_6H_5)]_n$, with a carbon content of approximately 92 mass%. Poly(methyl methacrylate) has the formula $[CH_2C(CH_3)(CO_2CH_3)]_n$, with a carbon content of only about 60 mass% and contains oxygen atoms. At the high temperatures experienced during casting, the benzene ring in polystyrene is thermodynamically stable and does not decompose easily, resulting in a significant fraction of aromatic liquid products that ultimately convert to solid carbon. The oxygen-containing structures in PMMA promote a chain-stripping decomposition that generates mostly gaseous products, which can readily escape through the coating and sand.
For a copolymer containing equal parts of styrene and methyl methacrylate, the carbon content is approximately 76 mass%, and the decomposition behavior falls between the two homopolymers. My experimental results confirmed that the blended copolymer produced an acceptable level of carbon defects. The gas evolution characteristics of different materials at 1,000°C are summarized in Figure 4, which shows that the PMMA-containing materials evolve gas more rapidly and completely than pure polystyrene.
4.3 Effect of Pattern Density
The density of the foam pattern directly controls the amount of polymer material that must decompose and be evacuated during pouring. I produced patterns with densities of 15, 20, 25, 30, 35, and 40 kg/m³ and tested them under otherwise identical conditions. The results, shown in Table 11, demonstrate a clear correlation between pattern density and carbon defect severity. Patterns with density below 22 kg/m³ produced castings with no surface carbon defects, whereas patterns with densities above 35 kg/m³ produced castings with severe carbon defects.
| Pattern density (kg·m⁻³) | Filling time (s) | Carbon defect severity |
|---|---|---|
| 15 | 48 | None |
| 20 | 50 | None |
| 25 | 55 | Black spots |
| 30 | 62 | Visible carbon black |
| 35 | 71 | Severe carbon defects |
| 40 | 85 | Very severe carbon defects |
This relationship can be quantified by considering the total mass of polymer that must decompose for a given casting volume:
$$ m_{\text{polymer}} = \rho_{\text{pattern}} \times V_{\text{pattern}} $$
where $\rho_{\text{pattern}}$ is the pattern density and $V_{\text{pattern}}$ is the pattern volume. Higher pattern density means more polymer mass and therefore more decomposition products that must be evacuated from the mold. In my production practice, I established that for the transmission housing component, the optimal pattern density range is 18–22 kg/m³ for copolymers, balancing the need for pattern rigidity against the need to minimize decomposition products.
4.4 Effect of Pouring Temperature
Of all the process parameters I studied, pouring temperature has the most immediate and dramatic effect on carbon defect formation. Table 12 presents the results of my pouring temperature experiments. At pouring temperatures below 1,360°C, all castings showed carbon defects. The defect severity decreased progressively with increasing temperature, and at 1,440°C, none of the five castings exhibited carbon defects, although flash defects and coating erosion began to appear at this temperature.
| Pouring temperature (°C) | Number of castings | Defective castings | Defect description |
|---|---|---|---|
| 1,320 | 5 | 5 | Pouring failure, cold laps, severe carbon defects |
| 1,360 | 5 | 5 | Surface carbon defects, one with cold lap |
| 1,400 | 5 | 2 | One with carbon black at window, one at flange |
| 1,440 | 5 | 0 | No visible carbon defect |
| 1,480 | 5 | 0 | Sand burning and flash on surface |
The mechanism by which temperature influences carbon defect formation is twofold. First, higher temperatures favor the complete gasification of decomposition products over the formation of liquid residues. Second, higher metal temperature reduces the cooling rate of the metal front, giving the decomposition products more time to escape before the metal solidifies. The decomposition behavior of polystyrene can be characterized by the following Arrhenius relationship:
$$ k = A \exp\left(-\frac{E_a}{RT}\right) $$
where $k$ is the decomposition rate constant, $A$ is the pre-exponential factor, $E_a$ is the activation energy for decomposition, $R$ is the universal gas constant, and $T$ is the absolute temperature. Higher temperatures increase $k$ and favor the production of low-molecular-weight volatile products.
My gas chromatography analysis of the decomposition products at the metal front revealed that at 700°C for aluminum casting temperatures, the gas fraction consisted of only 40% small-molecule gases, with the remainder being high-boiling-point aromatic vapors. At 1,400°C for iron casting, the small-molecule gas fraction increased to 62%, and at 1,550°C for steel casting, it reached 75%. This confirms that higher pouring temperatures promote more complete decomposition to gas-phase products.
However, there is an upper limit beyond which increasing pouring temperature becomes counterproductive. At temperatures above 1,480°C, the gas evolution rate becomes so rapid that it creates large internal pressure in the mold cavity, which can damage the coating and cause sand penetration and flash defects. Therefore, I recommend a pouring temperature window of 1,400–1,460°C for gray iron castings produced by lost foam casting, which is approximately 30–60°C higher than that used in conventional green sand casting.
4.5 Effect of Coating Properties
The coating on the foam pattern serves as the primary pathway by which decomposition products escape from the mold cavity. The properties of the coating, particularly its permeability and wettability by liquid decomposition products, have a profound influence on carbon defect formation. Table 13 compares the performance of the three coatings in my experiments.
| Coating | Permeability at 1000°C | Defect rate (%) | Filling time (s) |
|---|---|---|---|
| American Ashland | 1.55 | 12 | 38 |
| German | 1.40 | 18 | 46 |
| Self-developed (initial) | 1.45 | 35 | 55 |
| Self-developed (improved) | 1.50 | 15 | 41 |
Although the initial self-developed coating had similar permeability to the commercial coatings, it produced a much higher carbon defect rate. Through further investigation, I found that this coating had poor wettability by liquid polystyrene. The wettability, characterized by the contact angle between the liquid decomposition products and the coating surface, is critical for the liquid products to spread, penetrate, and eventually permeate through the coating. As shown in Figure 5, a lower contact angle means better wetting and hence better transport of liquid products through the coating. Table 14 lists the contact angles of liquid polystyrene on various refractory materials.
| Refractory filler | Contact angle (degrees) |
|---|---|
| Bauxite | 18 |
| Quartz powder | 22 |
| Talc powder | 32 |
| Graphite powder | 12 |
The transport of liquid decomposition products through the coating can be described by Darcy’s law:
$$ Q = \frac{k A \Delta P}{\mu L} $$
where $Q$ is the volumetric flow rate through the coating, $k$ is the permeability of the coating, $A$ is the cross-sectional area, $\Delta P$ is the pressure difference across the coating, $\mu$ is the viscosity of the liquid decomposition products, and $L$ is the coating thickness. It is clear from this relationship that higher coating permeability, higher pressure differential, lower liquid viscosity, and thinner coatings all enhance the evacuation of liquid products from the mold cavity.
The pressure differential across the coating is influenced by the vacuum negative pressure applied to the mold. During filling, the pressure inside the mold cavity at the metal front increases as the decomposition products evolve, while the vacuum pulls the sand side of the coating to sub-atmospheric pressure. The resulting pressure gradient drives the liquid products through the coating. A higher vacuum negative pressure therefore promotes better evacuation of decomposition products and reduces carbon defects. However, excessive negative pressure can cause the metal to be drawn ahead of the main front along the mold walls, a phenomenon known as the “wall effect,” which can entrap decomposition products within the casting. The optimal negative pressure range that I established for the transmission housing was 0.04–0.06 MPa.
4.6 Effect of Sand Properties
After passing through the coating, the decomposition products must continue their journey through the sand layer to reach the atmosphere or the vacuum system. The permeability of the sand is therefore another critical factor influencing carbon defect formation. I tested three sand sieve fractions, and the results are presented in Table 15. The coarse sand (20–40 mesh) produced the lowest carbon defect rate, while the fine sand (70–100 mesh) produced the highest defect rate and the most severe filling problems.
| Sand mesh | Pouring temperature (°C) | Filling time (s) | Defect rate (%) | Backflow phenomenon |
|---|---|---|---|---|
| 20–40 | 1,400 | 36 | 8 | None |
| 40–70 | 1,400 | 44 | 15 | Occasional |
| 70–100 | 1,400 | 58 | 30 | Severe backflow |
The relationship between sand grain size and permeability is well established. For uniformly sized spherical particles, the permeability varies with the square of the particle diameter, as described by the Kozeny-Carman equation:
$$ K = \frac{\phi^3 d_p^2}{180(1-\phi)^2} $$
where $K$ is the hydraulic permeability, $\phi$ is the porosity of the sand bed, and $d_p$ is the mean particle diameter. Finer sand produces lower permeability, which impedes the evacuation of decomposition products and increases the incidence of carbon defects. However, the sand cannot be too coarse because the coating must be able to support the sand without penetration. In my production practice, I found that 40–70 mesh sand provides the best balance between permeability and surface finish for medium-size iron castings.
4.7 Effect of Reclaimed Sand Quality
In production, the sand is recycled to reduce costs. However, with repeated use, the thermal decomposition products of the foam pattern accumulate in the sand, increasing its loss-on-ignition and reducing its permeability. I measured the ash content and loss-on-ignition of new sand and sand that had been used for six months. The ash content increased from 0.2% to 1.2%, and the loss-on-ignition increased from 0.5% to 2.8%, as shown in Figure 6. This degradation in sand quality directly increases the tendency for carbon defect formation. Based on my measurements, I established a sand replacement policy that helps maintain acceptable sand quality and low carbon defect rates.
4.8 Effect of Vacuum Negative Pressure
The vacuum negative pressure is a unique feature of the lost foam casting process. It serves two essential functions: mechanically supporting the dry sand and actively evacuating the decomposition products. My experiments showed that without negative pressure, the mold collapses immediately after pouring, as the sand has no binding force to maintain its shape. With increasing negative pressure, the carbon defect rate decreases, but excessive pressure causes metal penetration and sand sintering.
| Negative pressure (MPa) | Carbon defect rate (%) | Other casting defects |
|---|---|---|
| 0 | 60 | Mold collapse |
| 0.02 | 45 | Sand burning, partial collapse |
| 0.04 | 10 | No other defects |
| 0.05 | 8 | No other defects |
| 0.06 | 8 | No other defects |
| 0.08 | 10 | Surface sand adhesion, internal carbon clusters |
As shown in Table 16, the carbon defect rate does not decrease monotonically with increasing negative pressure. At very high negative pressure (0.08 MPa), the defect rate actually increases, and internal carbon defects appear. This is caused by the wall effect, where the metal is drawn preferentially along the mold walls by the strong negative pressure, creating a concave metal front that can trap decomposition products in the center of the casting. I determined that the optimal negative pressure for the transmission housing is 0.04–0.06 MPa.
4.9 Effect of Gating System Design
The gating system design directly controls the filling pattern of the metal and therefore the distribution of decomposition products. In my comparative experiments, I tested both top gating and bottom gating for an engine cover casting. With bottom gating, the last-filled region was at the top of the casting, where the decomposition products accumulated, causing severe carbon defects at a critical sealing surface. By switching to top gating, the metal filled the cavity in a more favorable pattern, and the carbon defect was eliminated. Based on this experience, I now carefully select the gating method based on the specific geometry of each casting, considering where the last-filled regions will be and whether they correspond to critical surfaces.
4.10 Effect of Casting Geometry
I found that the casting geometry has a significant influence on carbon defect susceptibility through its effect on the surface-area-to-volume ratio. I define the modulus of the casting as:
$$ M = \frac{V}{A} $$
where $V$ is the casting volume and $A$ is the surface area. A larger modulus means a relatively smaller surface area through which decomposition products can escape, and hence a greater tendency for carbon defects. Table 17 compares the modulus and defect rates for two different casting types that I produced.
| Property | Transmission housing | Pump body |
|---|---|---|
| Volume (dm³) | 18.5 | 6.2 |
| Surface area (dm²) | 75 | 31 |
| Modulus M = V/A (cm) | 0.25 | 0.20 |
| Carbon defect rate (%) | 12 | 6 |
These results confirm that castings with thinner walls and more intricate shapes, which have a larger surface area per unit volume, are less prone to carbon defects. This is consistent with the understanding that decomposition products escape more readily when there is a larger permeable area.
5. Countermeasures for Preventing Carbon Defects
Based on the systematic analysis presented above, I developed and implemented a comprehensive set of countermeasures to prevent and reduce carbon defects in lost foam castings. These measures have been rigorously validated in my production practice and have proven to be highly effective.
5.1 Selection of Pattern Material and Density
I adopted the use of a copolymer of styrene and methyl methacrylate (EPS/PMMA) instead of pure polystyrene. The optimal blend ratio was found to be 50% EPS and 50% EPMMA based on my experimental results. This ratio provides a carbon content of approximately 76 mass%, which significantly reduces the amount of solid carbon residue compared with pure EPS while maintaining acceptable gas evolution and cost. The pattern density is controlled to the minimum value that still ensures adequate pattern rigidity. For the transmission housing, I established a pattern density range of 18–22 kg/m³, which balances the requirement for dimensional accuracy against the need to minimize decomposition products. My established pre-expansion parameters for the copolymer beads are shown in Table 18.
| Parameter | Value |
|---|---|
| Bead type | EPS/EPMMA copolymer |
| Average diameter (mm) | 0.45 |
| Pre-expansion density (kg·m⁻³) | 18–20 |
| Molding pressure (MPa) | 0.25–0.35 |
| Storage time before use (h) | 12–48 |
| Drying temperature (°C) | 40–45 |
| Drying time (h) | 6–8 |
5.2 Optimization of Pouring Temperature
I established that the pouring temperature should be at least 30–60°C higher for lost foam casting than for conventional clay sand casting. For gray iron transmission housings, the pouring temperature is maintained at 1,400–1,460°C. For thin-walled castings, the temperature can be increased up to 1,480°C, but the risk of coating erosion and sand penetration must be monitored.
5.3 Enhancement of Coating Permeability and Wettability
I worked with my development team to formulate a coating with high permeability and good wettability by liquid polystyrene. The coating permeability is maintained above 1.5 cm/min at 1,000°C, and the coating thickness is controlled to 0.5–0.8 mm after drying. I also improved the ability of the coating to allow thermal decomposition products to pass through by optimizing the particle size distribution of the refractory fillers and the type of organic binders used.
5.4 Design of Gating and Riser Systems
For castings where carbon defects tend to occur at critical surfaces, I re-designed the gating system to place the critical surfaces away from the last-filled regions. Where necessary, I installed collector risers at locations where decomposition products are expected to accumulate. These risers serve as reservoirs for the carbon-rich liquid products, preventing them from remaining in the casting body. The risers are subsequently cut off in the finishing operation. In the transmission housing production, the collector riser was placed at the top of the casting, and when I sectioned the riser after solidification, I observed a significant accumulation of carbon-rich inclusions inside it.
5.5 Control of Sand Quality
I implemented a comprehensive sand management program that includes regular monitoring of sand permeability, loss-on-ignition, and ash content. Sand that exceeds the established limits is either regenerated or replaced. The fluidization and dust collection system is maintained to remove fine particles and combustion residues from the sand recirculation loop. The ventilation grids in the sand box are cleaned regularly to prevent blockage by condensed decomposition products.
5.6 Modification of Casting Design
In some cases, I worked with the component design engineers to make minor design changes that reduce the tendency for carbon defect formation. These changes include removing unnecessary thick sections, adding proper fillet radii at corners to avoid sharp transitions that create last-filled pockets, and adding machining allowance to surfaces where minor carbon defects might occur so that the defects are removed during machining.
5.7 Comprehensive Process Control
My experience has shown that no single countermeasure is sufficient; the entire process must be controlled holistically. I constructed a cause-and-effect diagram that summarizes all the factors influencing carbon defect formation and used it as a checklist during process development and troubleshooting. The factors I consistently monitor include pattern material and quality, pattern density, bonding adhesive application, coating composition and thickness, coating drying conditions, sand type and quality, compaction parameters, vacuum negative pressure, pouring temperature, and pouring time.
6. Conclusions
Through this comprehensive investigation of carbon defects in lost foam castings, I have reached the following conclusions.
First, carbon defects in lost foam castings are carbon-rich inclusions that form from the thermal decomposition products of the foam pattern. They contain more than 85% carbon by mass, with minor amounts of silicon, sulfur, and other impurities. These defects seriously deteriorate the mechanical properties, hardness, and pressure tightness of castings, and they also increase machining time and reduce tool life.
Second, the formation of carbon defects is closely related to the chemical composition and density of the pattern material. The carbon content of the pattern material is a primary factor: the higher the carbon content, the greater the tendency for carbon defect formation. The pattern density directly controls the amount of decomposition products, with higher densities resulting in more severe carbon defects.
Third, pouring temperature is a critically important factor. Higher pouring temperatures promote the complete gasification of decomposition products, reducing the amount of liquid residue. In my experiments, increasing the pouring temperature from 1,320°C to 1,440°C reduced the carbon defect rate from 100% to zero.
Fourth, the permeability and wettability of the coating and sand have a significant influence on the evacuation of decomposition products. Coatings and sands with higher permeability and better wettability allow decomposition products to escape more readily, reducing the carbon defect tendency.
Fifth, the vacuum negative pressure helps evacuate decomposition products from the mold. The optimal negative pressure for medium-size iron castings is 0.04–0.06 MPa. Lower pressures fail to adequately support the mold and evacuate gases, while higher pressures cause metal penetration and internal carbon defects due to the wall effect.
Finally, through the systematic application of these findings, I was able to reduce the carbon defect rate in the transmission housing from over 30% to less than 5%, enabling the stable mass production of high-quality lost foam castings. The insights gained from this study provide valuable guidance for the broader application of lost foam casting technology and for the continued improvement of casting quality in the industry.