
As a graduate researcher in mechanical engineering, I focus on the manufacturing challenges of the tractor saddle, which is a critical connecting component between the tractor and the semi-trailer. The saddle experiences severe impact loads from multiple directions, so its quality requirements are extremely high. Traditionally, the saddle is made of forged steel, which provides excellent impact resistance but is expensive. To reduce cost without sacrificing quality, my research explores replacing forged steel with ductile cast iron through a well-designed sand casting foundry process. However, during the early trials of this substitution, problems such as choking, cold shut, shrinkage porosity, sand inclusion, and slag inclusion frequently appeared. The rejection rate was high, causing significant economic losses. To solve these problems, I systematically designed the gating system, exhaust system, and filtration system for the saddle. I used the AnyCasting simulation software to analyze the transient behavior of molten metal during mold filling and solidification, including the evolution of velocity fields, temperature fields, and defect probability parameters. After several iterations, I proposed an optimized process and further refined it using orthogonal experiments. The final results were verified by ultrasonic testing and metallographic examination. This study provides both theoretical and practical support for the iron-for-steel substitution in tractor saddle production. In this paper, I present the complete methodology, the numerical simulation results, the optimization procedure, and the experimental validation.
1. Introduction and Research Background
Sand casting foundry technology is one of the oldest metal-forming methods, with a history of more than four thousand years. It remains the most widely used casting process because of its low tooling cost, flexibility in producing complex geometries, and suitability for mass production. In a sand casting foundry, molten metal is poured into a sand mold cavity, where it solidifies to form the desired shape. The quality of the final casting depends on many factors, including the properties of the molding sand, the design of the gating system, the pouring temperature, the filling speed, and the solidification sequence. In my project, the tractor saddle is a large thin-walled ductile iron casting with an overall size of 755 mm × 580 mm × 322 mm and a weight of about 63 kg. Because the saddle has many thin sections and some moderately thick sections, it is prone to defects such as shrinkage cavities, shrinkage porosity, cold shuts, sand inclusion, and slag entrapment. Therefore, a robust sand casting foundry process must be designed carefully, and numerical simulation is an efficient way to predict and eliminate defects before physical trials.
Over the past decades, numerical simulation has become an indispensable tool in sand casting foundry engineering. Internationally, researchers have developed various computational models to simulate mold filling and solidification. Early work by Paschkis in the 1940s laid the foundation for heat transfer calculations in casting. Later, finite element methods were applied to thermal analysis. With the advancement of computer technology, commercial software such as AnyCasting, ProCAST, and MAGMASOFT now allow engineers to visualize the progress of molten metal flow, temperature distribution, and defect formation. In China, significant progress has also been made since the late 1970s. Research groups have developed in-house codes for centrifugal casting, low-pressure casting, and investment casting. However, there is still a need for more accurate prediction of microstructure and defect formation, especially for complex thin-walled castings. My work contributes to this field by applying AnyCasting to a specific industrial component: the tractor saddle. The goal is to optimize the gating system and process parameters so that the sand casting foundry process can produce defect-free castings with high efficiency and low cost.
2. Structural Design and Material Selection
The tractor saddle is a load-bearing component that connects the tractor to the semi-trailer. It must withstand not only static loads but also dynamic impact forces during acceleration, braking, and turning. The original forged steel saddle had excellent toughness and strength, but its high cost motivated us to seek an alternative. Ductile iron, specifically the grade QT700-6, was selected because of its good strength, ductility, and fatigue resistance. The chemical composition of QT700-6 is given in Table 1.
| Element | C | Si | Mn | S | P | Mg | Ce | Cr | Cu | Mo |
|---|---|---|---|---|---|---|---|---|---|---|
| Content | 3.5–3.9 | 1.8–2.1 | 0.35–0.5 | 0.006–0.02 | ≤0.05 | 0.035–0.055 | 0.006–0.03 | ≤0.1 | 0.4–0.6 | ≤0.15 |
The mechanical property requirements for the saddle are: tensile strength ≥700 MPa, yield strength ≥420 MPa, elongation ≥6%, and hardness in the range of 240–290 HBW. The microstructure should consist of nodular graphite of type VI according to DIN EN ISO 945, with a graphite size of 5–8. The graphite nodules must be well spheroidized, and no flake graphite is allowed. In the as-cast condition, the pearlite content should be greater than or equal to 80%, and the ferrite content should be less than 20%.
To achieve these properties, the raw material mix was carefully designed. The charge consisted of 50–60% returned castings (including gating systems, risers, and rejected parts) and 40–50% steel scrap. Recarburizers and ferrosilicon were added to adjust the carbon and silicon contents. The melting process was carried out in an electric induction furnace. After the melt composition was verified, spheroidization treatment was performed using a magnesium-containing nodulizer. The molten metal was then poured into sand molds prepared by a two-box molding process.
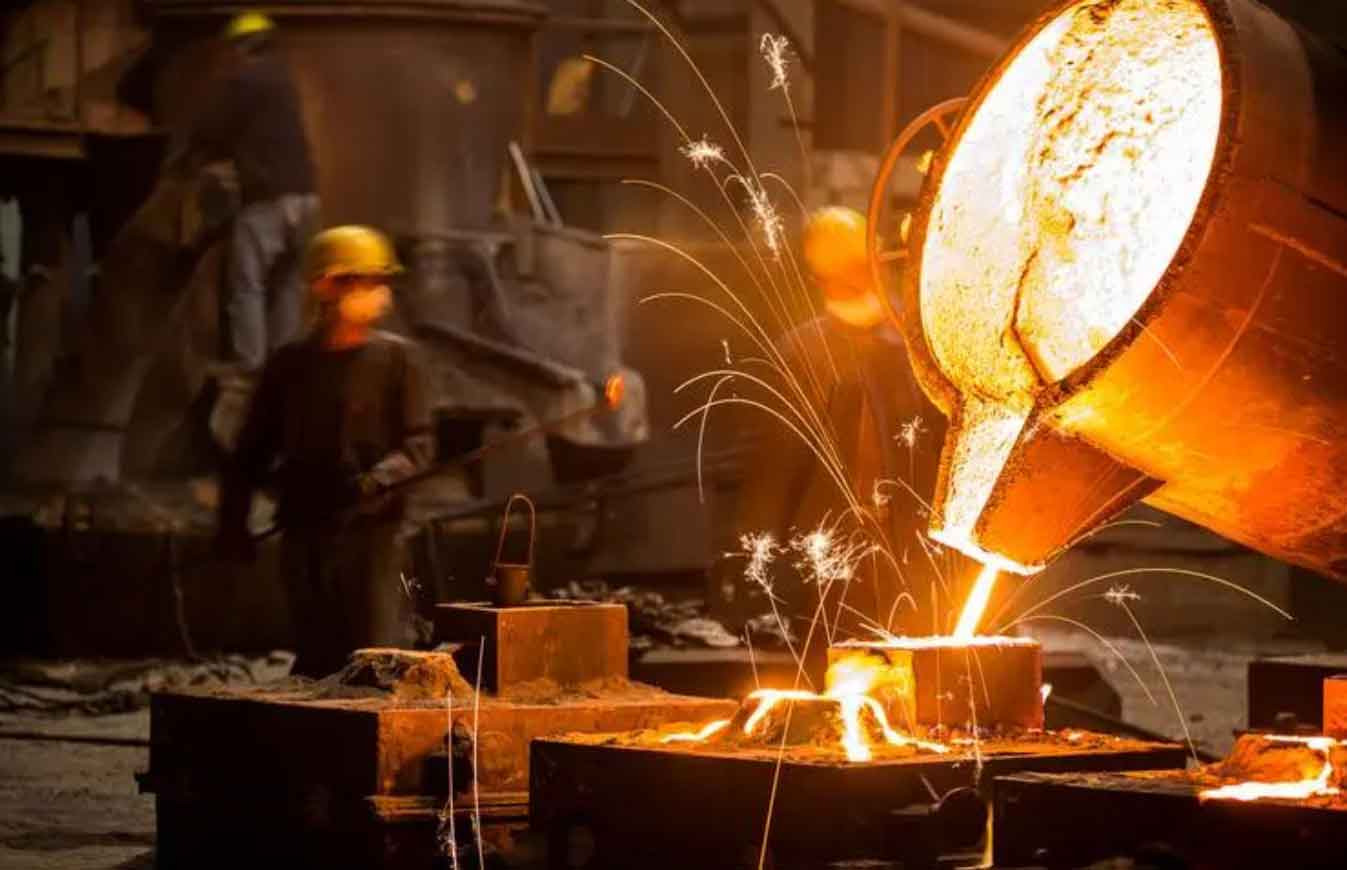
Figure 1 shows a typical view of a sand casting foundry operation, where the prepared molds are ready for pouring.
3. Sand Casting Process Design
The design of the sand casting foundry process for the tractor saddle includes several key aspects: molding method, parting surface, core design, process parameters, and the design of the gating, filtering, and exhausting systems.
3.1 Molding Method and Parting Surface
After analyzing the geometry of the saddle, I decided to use a two-box molding method with a horizontal parting surface. A vertical parting surface was also considered, but it would have required a very complex core structure and would have led to a large height difference of 794 mm, which is unfavorable for mold filling and pattern withdrawal. The horizontal parting surface allows a simpler core design and a more uniform filling pattern. The saddle is mounted with a specific assembly surface facing downward in the mold. Since inclusions and slag tend to float upward, placing the critical machined surface at the bottom ensures that any impurities accumulate in the upper part of the casting, which is later removed. This arrangement improves the surface quality of the functional face.
3.2 Shrinkage Allowance and Tolerances
The linear contraction of ductile iron varies with the casting structure and whether the contraction is free or restrained. For this saddle, the free contraction rate is 0.9–1.1%, while the restrained contraction rate is 0.6–0.8%. Considering the actual structure, I selected a contraction allowance of 1.1% for the pattern design. The dimensional tolerance grade for sand-cast ductile iron is CT11 to CT13, and I chose CT12. The machining allowance was selected according to the standard F–H, with a draught angle of 3° to facilitate pattern withdrawal.
3.3 Core Design
The internal cavity of the saddle is completely through, so a single sand core was used to reduce labor and improve dimensional accuracy. The core is made of cold-box sand, which offers good strength, high permeability, and low gas evolution. The core prints were designed to provide stable positioning. Vertical core prints have dimensions of 108 mm × 75 mm × 42 mm on the top and 108 mm × 98 mm × 42 mm on the bottom. In the horizontal direction, the core prints are symmetric, with a large print of 64 mm on the rear left side and a small print of 35 mm on the front left side. The core print taper is 3°. This core design ensures that the core does not shift or rotate during mold assembly and pouring.
4. Theoretical Fundamentals of Mold Filling and Solidification
To simulate the sand casting foundry process, it is essential to establish the mathematical models that govern the flow and heat transfer of molten metal. The flow of liquid metal during mold filling is an incompressible viscous flow, which can be described by the continuity equation, the Navier-Stokes equations, and the energy equation.
4.1 Continuity Equation
The mass conservation equation for the molten metal is:
$$
\frac{\partial \rho}{\partial t} + \frac{\partial (\rho u)}{\partial x} + \frac{\partial (\rho v)}{\partial y} + \frac{\partial (\rho w)}{\partial z} = 0
$$
where ρ is the density, t is time, and u, v, w are the velocity components in the x, y, z directions. For steady incompressible flow, this becomes:
$$
\frac{\partial u}{\partial x} + \frac{\partial v}{\partial y} + \frac{\partial w}{\partial z} = 0
$$
4.2 Momentum Equations
The motion of molten metal is described by the Navier-Stokes equations:
$$
\rho \left( \frac{\partial u}{\partial t} + u\frac{\partial u}{\partial x} + v\frac{\partial u}{\partial y} + w\frac{\partial u}{\partial z} \right) = -\frac{\partial p}{\partial x} + \mu \nabla^2 u + \rho g_x
$$
$$
\rho \left( \frac{\partial v}{\partial t} + u\frac{\partial v}{\partial x} + v\frac{\partial v}{\partial y} + w\frac{\partial v}{\partial z} \right) = -\frac{\partial p}{\partial y} + \mu \nabla^2 v + \rho g_y
$$
$$
\rho \left( \frac{\partial w}{\partial t} + u\frac{\partial w}{\partial x} + v\frac{\partial w}{\partial y} + w\frac{\partial w}{\partial z} \right) = -\frac{\partial p}{\partial z} + \mu \nabla^2 w + \rho g_z
$$
where μ is the dynamic viscosity and g is the gravitational acceleration.
4.3 Energy Equation
The energy conservation during mold filling and solidification is given by:
$$
\rho C_p \left( \frac{\partial T}{\partial t} + u\frac{\partial T}{\partial x} + v\frac{\partial T}{\partial y} + w\frac{\partial T}{\partial z} \right) = \frac{\partial}{\partial x}\left( k\frac{\partial T}{\partial x} \right) + \frac{\partial}{\partial y}\left( k\frac{\partial T}{\partial y} \right) + \frac{\partial}{\partial z}\left( k\frac{\partial T}{\partial z} \right) + Q
$$
where Cp is the specific heat, k is the thermal conductivity, T is temperature, and Q is the heat source term representing latent heat release during solidification. The latent heat Q is expressed as:
$$
Q = \rho L \frac{\partial f_s}{\partial t}
$$
where L is the latent heat and f_s is the solid fraction.
4.4 Shrinkage Porosity Prediction
The formation of shrinkage cavities and porosity is related to the inability of liquid metal to compensate for volumetric contraction during solidification. Several criteria can predict these defects. The temperature gradient criterion is:
$$
G = \sqrt{\left(\frac{\partial T}{\partial x}\right)^2 + \left(\frac{\partial T}{\partial y}\right)^2 + \left(\frac{\partial T}{\partial z}\right)^2}
$$
The cooling rate is defined as:
$$
R = \frac{T_{upper} – T_{lower}}{t_{upper} – t_{lower}}
$$
where T_upper and T_lower are the liquidus and solidus temperatures, respectively. A commonly used criterion is the ratio G/√R. If this ratio is less than a critical value (typically 0.8), shrinkage porosity is likely to occur. In my simulation, the defect parameters were automatically calculated by AnyCasting based on these criteria.
5. Gating System Design
The gating system is one of the most important parts of a sand casting foundry process. It controls the flow of molten metal into the mold cavity. A well-designed gating system should fill the mold quickly, minimize turbulence, prevent slag entrapment, and promote directional solidification. For the tractor saddle, I decided to use a closed gating system, which means the total cross-sectional areas satisfy the ratio:
$$
\sum A_{inner} : \sum A_{runner} : \sum A_{sprue} = 1 : 1.65 : 1.9
$$
The closed gating system is advantageous because it remains full of liquid metal during pouring, which helps to prevent slag and gas from entering the mold cavity. The gating system consists of a pouring cup, a sprue, a runner, and multiple ingates.
5.1 Determination of Pouring Time
The total weight of the casting plus the gating system is about 157 kg. The pouring time was calculated using the empirical formula for iron castings lighter than 450 kg:
$$
t = S \sqrt{G}
$$
where G = 157 kg, and S is a coefficient depending on the wall thickness. For the saddle with an average wall thickness of 10 mm, S = 1.85. Thus, the pouring time is:
$$
t = 1.85 \times \sqrt{157} \approx 14 \text{ s}
$$
5.2 Effective Static Head
The average static pressure head affects the filling velocity and must be determined properly. For a bottom-gated system, the average pressure head is calculated by:
$$
H_p = H_0 – \frac{h_0^2}{2h}
$$
where H_0 is the height from the sprue top to the ingate (30 cm), h is the total height of the casting (32 cm), and h_0 is the height of the casting above the ingate (32 cm). Substituting the values gives:
$$
H_p = 30 – \frac{32^2}{2 \times 32} = 14 \text{ cm}
$$
5.3 Minimum In-Gate Area
The total area of the ingates is calculated by the hydraulic formula:
$$
\sum A_{inner} = \frac{G}{\mu t \sqrt{2 g H_p}}
$$
where μ is the flow coefficient, which was taken as 0.64 for ductile iron with a filter. Substituting G = 157 kg, t = 14 s, g = 980 cm/s², and H_p = 14 cm:
$$
\sum A_{inner} = \frac{157}{0.64 \times 14 \times \sqrt{2 \times 980 \times 14}} \approx 15.6 \text{ cm}^2
$$
5.4 Three Gating Schemes
To investigate the effect of the number of ingates on the filling behavior and defect formation, I designed three schemes with 4, 6, and 8 ingates. The total in-gate area was kept constant at 15.6 cm². Therefore, the area of a single ingate for each scheme is:
- 4 ingates: 3.9 cm² per ingate, square cross-section with side length 2.0 cm
- 6 ingates: 2.6 cm² per ingate, square cross-section with side length 1.6 cm
- 8 ingates: 1.95 cm² per ingate, square cross-section with side length 1.4 cm
The runner and sprue cross-sections were the same for all three schemes. The runner area was computed as 1.65 times the total ingate area:
$$
\sum A_{runner} = 1.65 \times 15.6 = 25.74 \text{ cm}^2
$$
The square runner cross-section has a side length of 5.0 cm. The sprue area was 1.9 times the total ingate area:
$$
\sum A_{sprue} = 1.9 \times 15.6 = 29.64 \text{ cm}^2
$$
The sprue is cylindrical, so the diameter is calculated from the area:
$$
d = \sqrt{\frac{4 \times 29.64}{\pi}} \approx 6.1 \text{ cm}
$$
I selected a sprue diameter of 60 mm to facilitate standard mold production. The three gating schemes were modeled in three dimensions and used for numerical simulations. Table 2 summarizes the dimensions of each scheme.
| Scheme | Number of ingates | Single ingate area (cm²) | Ingate side (cm) | Sum A_inner (cm²) | Sum A_runner (cm²) | Sum A_sprue (cm²) |
|---|---|---|---|---|---|---|
| 1 | 4 | 3.9 | 2.0 | 15.6 | 25.74 | 29.64 |
| 2 | 6 | 2.6 | 1.6 | 15.6 | 25.74 | 29.64 |
| 3 | 8 | 1.95 | 1.4 | 15.6 | 25.74 | 29.64 |
6. Filtration and Exhaust System Design
6.1 Filtration System
In a sand casting foundry, molten metal often contains various inclusions originating from the melting process, ladle refractories, and deoxidation products. These inclusions can cause slag defects in the final casting. To eliminate them, I employed a multi-stage filtration system. A flow restrictor was placed at the exit of the sprue to reduce the initial impact and allow inclusions to float. A ceramic foam filter with dimensions 90 mm × 90 mm × 22 mm and a pore density of 10 ppi was placed in the runner system. In addition, a slag collector was added at the end of the runner to trap the last portion of metal, which usually contains more inclusions. This combination of filtration devices significantly improved the cleanliness of the molten metal before it entered the cavity.
6.2 Exhaust System
Proper venting is essential in a sand casting foundry to prevent gas defects such as blowholes and air entrapment. The exhaust system must allow the escape of air and gas generated by the mold and core during pouring. I designed vent holes both in the cavity and in the core. The total exhaust area was calculated using the empirical formula:
$$
S = (1.5 \sim 4) \times \frac{G \rho}{\mu_t t \sqrt{h_p}}
$$
where G is the pouring weight (157 kg), ρ is the density of molten iron (6.984 kg/cm³), μ_t is a velocity factor (0.35 with a filter), t is the pouring time (14 s), and h_p is the pouring pressure head (14 cm). For a casting with wall thickness greater than 15 mm, the factor 1.5 was used. Thus:
$$
S = 1.5 \times \frac{157 \times 6.984}{0.35 \times 14 \times \sqrt{140}} \approx 11 \text{ cm}^2
$$
I placed one large vent at the runner end (area 8 cm²) and two small vents at the highest point of the casting (each with an area of 1.5 cm²). For the sand core, venting was provided by channels along the core prints to guide gas out through the parting plane. The core sand had high permeability and low gas evolution, which further helped to prevent gas-related defects.
7. Numerical Simulation Setup
I used the AnyCasting simulation software to model the filling and solidification of the tractor saddle. The three-dimensional CAD model of the saddle and gating system was created in UG NX and exported in STL format. The STL files were imported into AnyCasting’s pre-processor (anyPRE), where the mesh was generated. Because of the complex geometry, I used local mesh refinement in critical regions. The mesh size was set to 2.2 mm³ for the core region, 4.5 mm³ for the gating channels, and 9.1 mm³ for the casting cavity. The number of cells for the entire model is summarized in Table 3.
| Region | Mesh size (mm³) | Number of cells |
|---|---|---|
| Core | 2.2 | 789,085 |
| Gating system (runner and ingates) | 4.5 | 160,069 |
| Casting cavity | 9.1 | 382,641 |
The initial and boundary conditions were set as follows: the pouring temperature was initially 1395°C, the pouring time was 14 s, the gravity vector was 9.8 m/s² along the positive x-direction, and the mold was filled with sand with a constant initial temperature of 25°C. The heat transfer coefficient at the metal-mold interface was defined as a function of temperature and solid fraction. The material model for QT700-6 (FCD700) included temperature-dependent thermophysical properties, such as density, specific heat, thermal conductivity, and thermal expansion coefficient. These properties are shown in Figure 2 as curves of density vs. temperature and thermal conductivity vs. temperature.
8. Simulation Results and Discussion
8.1 Mold Filling Simulation and Velocity Fields
I simulated the mold filling process for all three gating schemes. The velocity field at different filling stages was analyzed to evaluate the stability of the flow. For the 4-ingate scheme, the molten metal entered the cavity with a high and unstable velocity. The local velocity reached 157 mm/s at 35% filling, and the velocity difference between adjacent regions was large, indicating turbulent flow. This turbulence can cause air entrapment and oxide film formation, leading to gas pores and inclusions. At 55% filling, the maximum velocity was still 179 mm/s, which is dangerously high for a thin-walled casting. The molten metal could not fill the cavity smoothly, and some sections remained starved, increasing the risk of sand erosion and cold shuts. Therefore, the 4-ingate scheme was considered unsuitable.
For the 6-ingate scheme, the filling process was much more stable. At 24% filling, the molten metal was uniformly distributed through all six ingates. At 36% filling, the cavity was gradually filled without strong jetting or turbulence. The maximum velocity was lower than 100 mm/s and the velocity distribution was relatively uniform. At 94% filling, the melt reached the top of the casting smoothly. No visible air entrapment or cold shut was observed. This scheme demonstrated the best filling characteristics among the three.
For the 8-ingate scheme, the filling was also relatively stable during the initial and middle stages. At 25% filling, the melt entered the cavity through all eight ingates. The velocity was fairly uniform up to 55% filling. However, near the end of filling (95%), the melt velocity increased slightly, and there was a small degree of turbulence. Although not as severe as the 4-ingate scheme, this could potentially cause defects in the final casting. Overall, the 8-ingate scheme was acceptable but not as good as the 6-ingate scheme.
8.2 Solidification Simulation and Temperature Fields
Solidification analysis was performed by monitoring the temperature field evolution. The solidification sequence determines the location of shrinkages. In the 4-ingate scheme, isolated liquid regions began to appear at 66.2% solidification. These regions were small and scattered, which is generally not favorable for feeding. At 85.9% solidification, some isolated liquid pockets remained, which can lead to micro-shrinkage if not properly fed. The 6-ingate scheme showed a more favorable solidification pattern. At 65% solidification, the isolated liquid regions were small and mostly concentrated in the runner system. At 91.9% solidification, only a tiny isolated region remained, which was insignificant. The 8-ingate scheme exhibited elongated isolated regions near the edges of the casting at 66.5% solidification. At 85.4% solidification, several large isolated liquid regions were still present, which would likely result in shrinkage porosity. Therefore, the 6-ingate scheme provided the best solidification behavior.
8.3 Defect Probability Analysis
AnyCasting’s defect prediction module was used to evaluate the probability of shrinkage cavities and porosity. The defect probability maps for the three schemes are compared in Table 4.
| Scheme | Overall defect map | Defect locations and severity |
|---|---|---|
| 4 ingates | Many defect points | Linear defects on top surface, large defective area in the cavity, linear defects at the bottom |
| 6 ingates | No obvious defects | Only a small linear defect near the lower lock hole; all other areas sound |
| 8 ingates | Defects on both lateral edges | Linear red defects on top surface, dense defect zones in the cavity, small linear defects at bottom |
Based on the comprehensive comparison of filling stability, solidification sequence, and defect probability, the 6-ingate gating system was selected as the optimal initial design. This scheme uses a closed gating system with 1 sprue, 1 runner, and 6 square ingates. The pouring temperature was initially 1395°C, and the pouring time was 14 s. The gating ratio is ∑A_inner : ∑A_runner : ∑A_sprue = 1 : 1.65 : 1.9, with each ingate having a cross-sectional area of 2.6 cm², the runner area being 25.74 cm², and the sprue area being 29.64 cm². The casting is designed without risers and without chillers, which simplifies the mold and reduces cost.
9. Orthogonal Experiment Optimization
Although the 6-ingate scheme was promising, there was still a small linear defect near the lower lock hole. To further reduce the shrinkage porosity and improve the filling quality, I carried out an orthogonal experiment design. The goal was to find the optimal combination of process parameters that minimizes the total pore volume and solidification time.
9.1 Experimental Design
Four factors were considered: pouring temperature (A), filling pressure (B), pouring velocity (C), and liquid metal weight (D). Each factor was tested at three levels. The chosen levels are listed in Table 5. The orthogonal array L9(3⁴) was employed to reduce the number of experiments to nine. The experimental scheme is shown in Table 6.
| Level | A: Pouring temp (°C) | B: Filling pressure (Pa) | C: Pouring velocity (m/s) | D: Metal weight (kg) |
|---|---|---|---|---|
| 1 | 1395 | 1.0 | 0.34 | 157 |
| 2 | 1385 | 0.9 | 0.30 | 155 |
| 3 | 1405 | 1.1 | 0.40 | 159 |
| Exp. | A | B | C | D |
|---|---|---|---|---|
| 1 | 1 | 1 | 1 | 1 |
| 2 | 1 | 2 | 2 | 2 |
| 3 | 1 | 3 | 3 | 3 |
| 4 | 2 | 1 | 2 | 3 |
| 5 | 2 | 2 | 3 | 1 |
| 6 | 2 | 3 | 1 | 2 |
| 7 | 3 | 1 | 3 | 2 |
| 8 | 3 | 2 | 1 | 3 |
| 9 | 3 | 3 | 2 | 1 |
9.2 Results and Range Analysis
The numerical simulations were carried out for each of the nine experiments. The total pore volume and the solidification time were recorded as the responses. The results are summarized in Table 7.
| Exp. | A (℃) | B (Pa) | C (m/s) | D (kg) | Pore volume (cm³) | Solidification time (h) |
|---|---|---|---|---|---|---|
| 1 | 1395 | 1.0 | 0.34 | 157 | 0.986 | 0.5575 |
| 2 | 1395 | 0.9 | 0.30 | 155 | 0.654 | 0.5581 |
| 3 | 1395 | 1.1 | 0.40 | 159 | 0.473 | 0.5542 |
| 4 | 1385 | 1.0 | 0.30 | 159 | 0.813 | 0.5458 |
| 5 | 1385 | 0.9 | 0.40 | 157 | 0.634 | 0.5411 |
| 6 | 1385 | 1.1 | 0.34 | 155 | 0.746 | 0.5417 |
| 7 | 1405 | 1.0 | 0.40 | 155 | 0.682 | 0.5708 |
| 8 | 1405 | 0.9 | 0.34 | 159 | 0.914 | 0.5728 |
| 9 | 1405 | 1.1 | 0.30 | 157 | 0.753 | 0.5739 |
The range analysis was performed for each response. For the pore volume, the K values and ranges are shown in Table 8.
| A | B | C | D | |
|---|---|---|---|---|
| K1 | 0.704 | 0.827 | 0.882 | 0.791 |
| K2 | 0.731 | 0.734 | 0.740 | 0.694 |
| K3 | 0.783 | 0.657 | 0.596 | 0.733 |
| R | 0.079 | 0.170 | 0.286 | 0.097 |
The range R indicates the significance of each factor. For pore volume, the order is C > B > D > A, meaning that pouring velocity has the largest influence, followed by filling pressure, metal weight, and pouring temperature. The optimal combination based on the smallest K values is A1, B3, C3, D2, i.e., pouring temperature 1395°C, filling pressure 1.1 Pa, pouring velocity 0.40 m/s, and metal weight 155 kg. However, for the solidification time, the range analysis shown in Table 9 gives a different optimal combination.
| A | B | C | D | |
|---|---|---|---|---|
| K1 | 0.5566 | 0.5580 | 0.5573 | 0.5575 |
| K2 | 0.5429 | 0.5573 | 0.5593 | 0.5569 |
| K3 | 0.5725 | 0.5566 | 0.5554 | 0.5576 |
| R | 0.0296 | 0.0014 | 0.0039 | 0.0007 |
For solidification time, the order is A > C > B > D, with pouring temperature being the most significant factor. The optimal combination for solidification time is A2, B3, C3, D2. Since the two responses yield slightly different optimal levels for factor A, I used matrix analysis to determine a balanced optimal solution for both responses.
9.3 Matrix Analysis for Multi-Objective Optimization
Matrix analysis is a systematic method for handling multi-objective orthogonal experiments. It calculates the weight of each factor level by considering all responses together. The detailed procedure involves constructing the indicator layer matrix M, the factor layer matrix T, and the level layer matrix S. Using the formulas:
$$
\omega_i = M_i \cdot T_i \cdot S_i
$$
where ω_i is the comprehensive weight for the i-th factor level. After performing the matrix operations for both pore volume and solidification time, the comprehensive weights were obtained. The highest weight for each factor indicates the best level. The results are presented in Table 10.
| Factor | Level 1 | Level 2 | Level 3 | Best level |
|---|---|---|---|---|
| A (Pouring temp) | 0.1605 | 0.1632 | 0.1545 | A2 |
| B (Filling pressure) | 0.0463 | 0.0513 | 0.0566 | B3 |
| C (Pouring velocity) | 0.0799 | 0.0916 | 0.1095 | C3 |
| D (Metal weight) | 0.0271 | 0.0305 | 0.0290 | D2 |
The matrix analysis indicates that the optimal combination is A2, B3, C3, D2, i.e., pouring temperature 1385°C, filling pressure 1.1 Pa, pouring velocity 0.40 m/s, and metal weight 155 kg. This combination was selected as the final optimum scheme because it simultaneously minimizes pore volume and solidification time.
10. Verification of the Optimal Solution
10.1 Numerical Simulation Verification
To verify the selected optimal process parameters, I performed another simulation using the conditions of A2B3C3D2. The simulated filling process showed a very smooth flow pattern. At 22% filling, the melt advanced uniformly through all six ingates. At 38% filling, no turbulence or backflow was observed. At 58%, the melt front moved upward steadily, and at 96%, the cavity was completely filled without any visible defects. The solidification sequence was also improved. At 4.9% solidification, the thin sections began to solidify first. At 24.7%, the solidification front advanced regularly. At 68.2%, only a few small isolated liquid regions appeared. At 92.2%, these regions were almost eliminated. The defect probability map revealed that the small linear defect near the lower lock hole had completely disappeared. The total pore volume was reduced to 0.401 cm³, which is the lowest among all simulated cases. Therefore, the optimized process parameters were confirmed to be effective.
10.2 Experimental Validation
After the simulation study, I produced physical tractor saddles using the optimized sand casting foundry process. The process parameters were: pouring temperature 1385°C, filling pressure controlled by a pouring cup with a height corresponding to 1.1 Pa equivalent, pouring velocity 0.40 m/s, and metal weight 155 kg. The gating system was the 6-ingate closed system. The molds were prepared with the same sand mixture and core design as described earlier. After cooling and shakeout, the castings were cleaned and inspected visually. The surface quality was excellent, with no visible shrinkage, sand inclusion, or slag defects.
Two batches of 14 castings were randomly selected for ultrasonic inspection. All castings passed the inspection without any significant internal defects. The castings were then subjected to metallographic examination and mechanical testing. A sample was cut from the saddle and etched with nitric acid alcohol to reveal the microstructure. The results are shown in Table 11.
| Sample | Elongation A (%) | Yield strength (MPa) | Tensile strength (MPa) | Hardness (HBW) | Graphite size (grade) | Pearlite content (%) | Nodularity type |
|---|---|---|---|---|---|---|---|
| 01K | 10.0 | 424 | 739 | 245 | 6 | 80 | VI |
| 02K | 10.3 | 412 | 725 | 247 | 6 | 81 | VI |
| 03K | 10.7 | 426 | 747 | 248 | 6 | 80 | VI |
| 04K | 10.0 | 411 | 749 | 240 | 6 | 75 | VI |
| 05K | 10.2 | 436 | 728 | 246 | 6 | 80 | VI |
| 06K | 10.1 | 432 | 735 | 249 | 6 | 81 | VI |
| 07K | 10.3 | 416 | 736 | 247 | 6 | 81 | VI |
| 08K | 10.6 | 414 | 745 | 245 | 6 | 80 | VI |
| 09K | 10.5 | 433 | 742 | 247 | 6 | 82 | VI |
| 10K | 10.2 | 421 | 728 | 249 | 6 | 82 | VI |
| 11K | 10.0 | 424 | 726 | 246 | 6 | 81 | VI |
| 12K | 10.1 | 410 | 731 | 248 | 6 | 80 | VI |
| 13K | 10.1 | 433 | 744 | 246 | 6 | 83 | VI |
| 14K | 10.5 | 424 | 742 | 247 | 6 | 82 | VI |
All the tested samples met the required mechanical properties. The elongation exceeded 10%, which is much higher than the minimum requirement of 6%. The tensile strength was above 700 MPa in every case. The hardness was in the range of 240–250 HBW, which is acceptable. The graphite was classified as type VI with a size grade of 6, indicating excellent spheroidization. The pearlite content was above 80% for most samples, which satisfies the requirement. One sample (04K) had a pearlite content of 75%, which is slightly below the target but still within the acceptable range for this application because the tensile strength was the highest (749 MPa). The yield strength also exceeded the specified value.
Compared to the original production process, the optimized sand casting foundry process increased the qualification rate from 60% to over 95%. This dramatic improvement is attributed to the combination of a well-designed 6-ingate closed gating system, the multi-stage filtration, the proper exhaust design, and the optimized process parameters. The reduction in scrap not only saves material and energy but also improves production efficiency and reduces the overall manufacturing cost of the tractor saddle.
11. Discussion of Defect Mechanisms
During the development of the sand casting foundry process, I also investigated the mechanisms of typical defects in ductile iron castings. The main defects observed in the original process were choking (gas-related), cold shuts, shrinkage cavities, shrinkage porosity, sand inclusion, and slag inclusion. Choking occurs when the gas pressure generated by the mold and core exceeds the pressure of the molten metal, preventing complete filling. This was caused by insufficient venting and a low pouring temperature. The optimized exhaust system and the appropriate pouring temperature of 1385°C effectively eliminated this problem. Cold shuts are caused by the premature solidification of molten metal before it completely merges with another stream. The use of a lower pouring temperature might seem unfavorable, but the six-ingate system ensures a uniform distribution of metal throughout the cavity, reducing the chance of cold shuts. Shrinkage cavities and porosity in ductile iron are closely related to the volume changes during solidification. Ductile iron undergoes a complex sequence of liquid contraction, graphite expansion, and eutectic contraction. If the graphite expansion can compensate for the liquid contraction, no external feeding is needed. This is why the no-riser, no-chill design worked successfully for this thin-walled saddle. The 6-ingate gating system allowed the metal to solidify with a favorable temperature gradient, and the matrix analysis helped to find the optimal balance between pore volume and production time.
Sand inclusion and slag inclusion are often caused by the erosion of the mold and the entrainment of oxidized metal. The closed gating system with a proper ratio (1:1.65:1.9) keeps the gating system full and prevents slag from being drawn into the cavity. The ceramic foam filter and slag trap remove inclusions before the metal enters the cavity. The careful placement of ingates away from critical surfaces also prevented mold erosion in the main body of the casting.
12. Conclusions
In this research, I successfully developed and optimized a sand casting foundry process for manufacturing a tractor saddle using ductile iron QT700-6 as a substitute for forged steel. The main contributions and conclusions are:
- The structural design of the saddle was analyzed, and the optimal molding method was determined to be a two-box horizontal parting process. The core was designed as a single cold-box core, and the key process parameters were selected: linear contraction allowance 1.1%, CT12 tolerance, and draught angle 3°.
- Three different gating systems with 4, 6, and 8 ingates were designed using a closed gating ratio of 1:1.65:1.9. Numerical simulations showed that the 6-ingate system provided the smoothest mold filling, the most favorable solidification pattern, and the lowest defect probability. The detailed dimensions of the selected system were: one sprue of 60 mm diameter, one runner with a 50 mm square cross-section, and six ingates each with a 16 mm square cross-section.
- An orthogonal experiment was performed to further optimize the process parameters. The optimal combination was found to be: pouring temperature 1385°C, filling pressure 1.1 Pa, pouring velocity 0.40 m/s, and metal weight 155 kg. The total pore volume was reduced to 0.401 cm³, which is significantly lower than the initial 0.986 cm³.
- Physical castings produced with the optimized parameters passed ultrasonic inspection. The mechanical properties exceeded the requirements, with a tensile strength of more than 700 MPa, an elongation of more than 10%, and a hardness of 240–250 HBW. The microstructure was fully nodular with type VI graphite and a pearlite content above 80%.
- The optimized sand casting foundry process improved the qualification rate from 60% to over 95%, demonstrating the effectiveness of combining numerical simulation, orthogonal experiments, and experimental validation in developing a robust casting process.
13. Future Work
Although the current process is successful, there is still room for further improvement. Future research could explore the use of other ductile iron grades with different heat treatment regimes to achieve even better mechanical properties. The thermophysical parameters used in the simulation were taken from the software database for FCD700; if the actual properties of QT700-6 were measured more precisely, the simulation accuracy could be further improved. In addition, the orthogonal experiment could be extended to include regression analysis to build a predictive model for the relationships between process parameters and defect formation. Finally, the numerical model could be enhanced to simulate microstructural evolution, such as graphite nodule count and ferrite/pearlite ratio, which would provide even deeper insight into the sand casting foundry process. Despite these potential improvements, the current study has successfully solved the practical problem of manufacturing high-quality tractor saddles with ductile iron, and the methodology can be readily adapted to similar large thin-walled castings in other applications.
Through this work, I have gained a comprehensive understanding of the sand casting foundry process, from the initial design to the final verification. The combination of simulation and experimental techniques has proven to be a powerful tool for optimizing casting quality and reducing costs. I believe that the findings of this research will benefit not only the tractor saddle producer but also other foundries facing similar challenges in the iron-for-steel substitution of structural components.