
I carried out this study as an applied casting process investigation. My main objective was to reduce casting defects in a top-entry ball valve steel casting made from WCB steel and produced by sand gravity casting. The part was large, geometrically complex, and characterized by a significant wall-thickness variation. These features made the filling and feeding behavior difficult to control. In my experience, casting defects such as shrinkage cavities, dispersed porosity, gas holes, non-metallic inclusions, and hot tears are not isolated events. They are the result of coupled thermal, fluid-flow, and solidification phenomena. Therefore, I treated the problem as a multi-physics optimization task rather than a simple trial-and-error foundry adjustment.
The original production route used resin-bonded sand molds, bottom gating, and several sand risers. Although this route was practical, the as-cast quality was not stable. The measured yield was about 78%, and non-destructive testing repeatedly revealed internal casting defects near the flange-to-body transition and in thicker sections. I wanted to understand why these casting defects formed and how they could be removed without increasing cost excessively. I therefore combined sand casting theory, computer-aided engineering, and production validation. The central tool was ProCAST, supported by NX12.0 for three-dimensional modeling and Visual-Mesh for meshing. My workflow followed a closed loop: design, simulation, defect prediction, process modification, orthogonal optimization, and final casting verification.
The casting defects that concerned me most were shrinkage porosity and shrinkage cavities. In steel castings, these casting defects arise from volumetric contraction during liquid cooling, solidification, and solid-state cooling. When the feeding channel closes before the last liquid pocket solidifies, the remaining liquid cannot compensate for contraction. A macro-scale cavity forms. When the interdendritic channels are too narrow or the temperature gradient is too low, a distributed micro-scale porosity forms. Both are casting defects, but they require different corrective actions. Macro cavities usually require improved riser design and feeding paths. Micro porosity usually requires better temperature gradients, chills, or modified pouring parameters.
$$t_s = B \left(\frac{V}{A}\right)^n$$
The equation above is the Chvorinov relationship that I used qualitatively to compare solidification times. Here, \(t_s\) is solidification time, \(V\) is volume, \(A\) is heat-transfer surface area, \(B\) is a mold constant, and \(n\) is an exponent usually close to 2 for many sand castings. The modulus \(M = V/A\) became a practical design index. For a sound casting, the riser modulus should exceed the modulus of the feeding zone. This is one of the simplest but most powerful rules for preventing casting defects.
$$M_r \ge 1.1 M_c$$
In this expression, \(M_r\) is the riser modulus and \(M_c\) is the casting modulus at the region being fed. For side blind risers and certain necked designs, I also considered the neck modulus \(M_n\). A typical relationship is shown below.
$$M_c : M_n : M_r = 1 : 1.1 : 1.2$$
Feeding volume must also match contraction demand. I used the following mass-balance concept:
$$V_r \ge \frac{\beta V_c}{\eta}$$
Here, \(V_r\) is the required riser volume, \(V_c\) is the casting volume being fed, \(\beta\) is the total contraction fraction, and \(\eta\) is the riser feeding efficiency. For ordinary sand risers, \(\eta\) is often about 12% to 20%. For exothermic and insulating risers, \(\eta\) can reach 30% to 60%. This difference was important because the original process used ordinary sand risers, and the simulation showed insufficient feeding. That insufficiency was directly linked to the observed casting defects.
I also evaluated defect susceptibility using the Niyama criterion. This criterion is widely used to predict micro-shrinkage casting defects. It combines local cooling rate and temperature gradient.
$$N_y = \frac{G}{\sqrt{R}}$$
In this equation, \(G\) is the local temperature gradient and \(R\) is the cooling rate. A region with a low Niyama value is more likely to contain shrinkage porosity. The critical value depends on alloy and casting size. For large steel castings, I used a conservative threshold near 1.1, while for smaller sections I considered values near 0.8. The Niyama criterion does not replace physical reasoning, but it gives a useful quantitative map of where casting defects are likely to appear.
Before presenting my optimization work, I should explain the wider industrial context. Sand casting remains one of the most flexible manufacturing methods for large metal components. It can produce complex geometries, accommodate many alloys, and support single-piece or batch production. However, the same flexibility creates process variability. Mold permeability, sand compaction, binder behavior, pouring temperature, gating geometry, and chill placement all influence casting defects. In large steel castings, the risk is amplified by long filling times and slow solidification. A small thermal imbalance can create a large defect. For this reason, I used simulation to examine the entire sequence rather than only the final geometry.
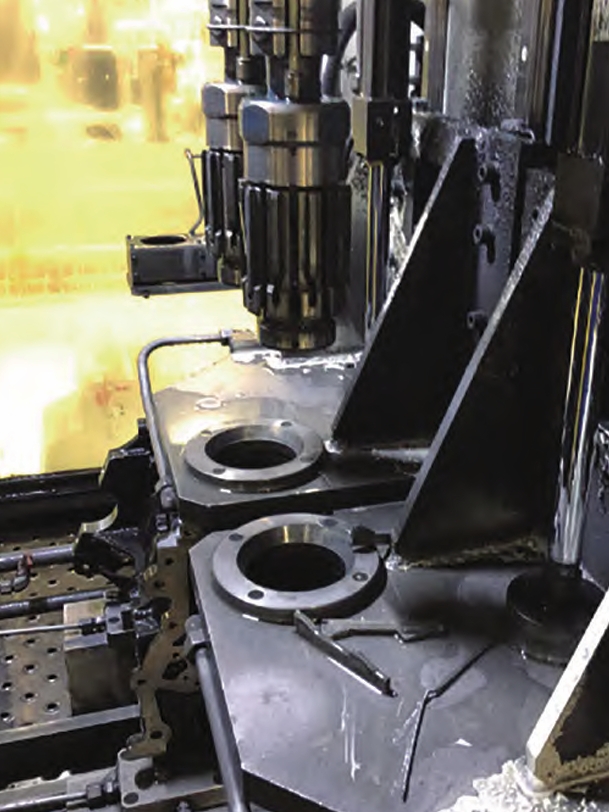
Complex industrial castings, such as engine cylinder blocks, pump housings, valve bodies, and transmission cases, share a common challenge. Their thin webs, thick bosses, and isolated hot spots create non-uniform cooling. If the process is not designed carefully, casting defects appear at the transitions. I saw the same pattern in the top-entry ball valve. The flange, central body, and internal cavity formed multiple hot spots. The bottom gating system filled the mold smoothly, but it also produced a temperature field that did not always favor directional solidification toward the risers.
I began with the governing equations of the filling and solidification model. The metal was treated as an incompressible Newtonian liquid during filling. I used mass conservation, momentum conservation, energy conservation, and a volume-of-fluid free-surface formulation. These equations are the foundation of the ProCAST solution.
$$\frac{\partial \rho}{\partial t} + \nabla \cdot (\rho \vec{v}) = 0$$
For incompressible flow, the continuity equation reduces to:
$$\nabla \cdot \vec{v} = 0$$
The momentum equation is the Navier-Stokes equation:
$$\rho \left( \frac{\partial \vec{v}}{\partial t} + \vec{v} \cdot \nabla \vec{v} \right) = -\nabla p + \mu \nabla^2 \vec{v} + \rho \vec{g}$$
In this equation, \(\rho\) is density, \(\vec{v}\) is velocity, \(p\) is pressure, \(\mu\) is dynamic viscosity, and \(\vec{g}\) is gravitational acceleration. During mold filling, turbulence can entrain gas and oxide films, leading to casting defects such as gas porosity and inclusion-related voids. I therefore preferred a bottom-gating layout because it promotes smoother filling. The metal enters low in the cavity and rises gradually. This reduces splashing and limits the entrapment of air and slag. However, bottom gating can produce a reverse temperature gradient, in which the lower part is hotter than the upper part. That condition can weaken feeding and increase shrinkage casting defects near the top sections.
The energy equation governs heat transfer and solidification:
$$\rho c_p \left( \frac{\partial T}{\partial t} + \vec{v} \cdot \nabla T \right) = \nabla \cdot (k \nabla T) + S$$
Here, \(c_p\) is specific heat capacity, \(T\) is temperature, \(k\) is thermal conductivity, and \(S\) is a source term. In solidification, the source term includes latent heat release. I used an enthalpy formulation to account for phase change:
$$H = \int_0^T c_p \, dT + f_s L$$
where \(H\) is enthalpy, \(f_s\) is solid fraction, and \(L\) is latent heat of fusion. The solid fraction is a critical variable because feeding stops when the solid network becomes coherent. In steel castings, a critical solid fraction of about 0.7 is often used to define the limit of useful feeding. Beyond that value, liquid flow through dendrites becomes difficult, and casting defects such as micro-shrinkage begin to form.
$$f_s \ge f_{s,crit} \approx 0.7$$
The free surface during filling was tracked with a volume-of-fluid approach:
$$\frac{\partial \alpha}{\partial t} + \nabla \cdot (\alpha \vec{v}) = 0$$
In this equation, \(\alpha\) is the volume fraction of metal. When \(\alpha = 0\), the cell is empty. When \(\alpha = 1\), the cell is full of metal. Intermediate values define the free surface. This method allowed me to visualize the filling front, detect possible cold shuts, and estimate where gas might be trapped. Each of these phenomena can generate casting defects.
I built the three-dimensional model in NX12.0. The assembly included the ball valve casting, bottom gating system, risers, chills, insulating sleeves, and a virtual sand mold. I exported the geometry in a neutral format and imported it into Visual-Mesh. I used local mesh refinement for the casting, chills, and critical riser necks. Coarser mesh was used for the sand box and distant mold regions. The final mesh contained approximately 90,000 surface elements and 460,000 volume elements, for a total of about 560,000 elements. This balance kept the computation practical while preserving enough resolution near expected casting defects.
| Mesh Region | Target Size | Reason for Refinement |
|---|---|---|
| Sand mold and virtual mold | 100 mm | Reduce computation while capturing bulk heat storage |
| Primary risers | 30 mm | Resolve feeding behavior and hot spot evolution |
| Thick-section feeding risers | 50 mm | Balance accuracy and cell count |
| Casting body and chills | 10 mm | Capture local gradients and casting defects |
| Insulating sleeves | 30 mm | Resolve reduced heat loss at riser surfaces |
For the material model, I used WCB cast steel. This material is common in valve and pressure-containing components because it offers a useful combination of strength, toughness, weldability, and cost. I entered the chemical composition and used the software thermodynamic solver to estimate thermophysical properties. The liquidus and solidus were about 1509 °C and 1472 °C, respectively. The resin-bonded sand mold was assigned as the mold material. I set the initial pouring temperature to 1570 °C, the mold initial temperature to 20 °C, and the pouring mass flow to 100 kg/s for the baseline case. The calculated filling time was about 90 s.
| WCB Composition Element | Specified Range, wt% | Typical Deviation |
|---|---|---|
| C | 0.25–0.30 | ±0.01 |
| Si | ≤ 0.60 | ±0.05 |
| Mn | ≤ 1.00 | ±0.05 |
| P | ≤ 0.040 | ±0.005 |
| S | ≤ 0.045 | ±0.005 |
| Cr | ≤ 0.50 | ±0.20 |
| Ni + Mo | ≤ 1.00 | ±0.02 |
| Mechanical Property | Specification | Typical Value |
|---|---|---|
| Tensile strength, MPa | ≥ 485 | 500–620 |
| Yield strength, MPa | ≥ 250 | 270–350 |
| Elongation, % | ≥ 22 | 25–32 |
| Hardness, HB | 137–179 | 150–180 |
Boundary conditions strongly influence predicted casting defects. I assigned different interface heat-transfer coefficients for metal-to-sand, metal-to-chill, and chill-to-sand contacts. The metal-to-sand coefficient was set to about 500 W/(m²·K). The metal-to-chill coefficient was set to about 2000 W/(m²·K). The insulating sleeve and sand contact was set to about 200 W/(m²·K). These values are not arbitrary. They determine how quickly heat leaves the liquid metal and therefore control solidification sequence. If the heat-transfer coefficient is too high, the simulation may show premature freezing and false casting defects. If it is too low, hot spots may persist unrealistically.
| Interface | Heat-Transfer Coefficient, W/(m²·K) | Influence on Casting Defects |
|---|---|---|
| Casting to resin sand | 500 | Controls general cooling and skin formation |
| Casting to chill | 2000 | Promotes local thermal gradients and reduces porosity |
| Chill to sand | 300–1000 | Moderates chill efficiency and local hot spots |
| Insulating sleeve to sand | 200 | Reduces heat loss from riser surfaces |
| Casting to air | 5–10 | Minor during mold filling and early solidification |
I used the gravity filling template in ProCAST. The gravity direction was set along the negative X-axis. The initial mold filling was zero, and the mold cavity was assigned a virtual mold condition. The melt inlet was a circular patch at the top of the sprue. The mass-flow calculator used 100 kg/s, and the filling limit was 100%. I set the simulation stop temperature to 1462 °C and the maximum number of steps to 50,000. Temperature field output was written every 10 steps. These settings allowed me to capture both the fast filling stage and the long solidification stage.
The original process design used a four-channel symmetric bottom-gating system. The sprue diameter was about 100 mm. Four main sand risers were placed on a flange platform, each approximately 500 mm × 450 mm. Additional cylindrical risers of about 325 mm × 225 mm were placed near complex sections. Four feeding risers were positioned in thicker central regions. Chills were placed at the flange and in the central cavity to break up hot spots. The intention was to create directional solidification from the casting toward the risers. In practice, the simulated and actual results showed that the feeding system was not strong enough.
| Original Process Feature | Approximate Value | Purpose |
|---|---|---|
| Gating type | Bottom gating | Smooth filling and reduced gas entrapment |
| Sprue diameter | 100 mm | Control flow rate and filling time |
| Primary risers | 500 mm × 450 mm | Feed flange and heavy sections |
| Auxiliary risers | 325 mm × 225 mm | Feed isolated hot spots |
| Central feeding risers | Four locations | Compensate thick-section contraction |
| Chills | Flange and internal cavity | Increase local cooling rate |
After filling, I examined the temperature field. The metal entered from the bottom and rose smoothly. The filling process was stable, with no obvious cold shut or misrun. However, the final temperature distribution was not ideal. The lower regions remained relatively hot, while some upper regions cooled too early. This created a temperature pattern that opposed effective feeding. In a sound steel casting, the hot spot should remain connected to the riser until the surrounding casting has frozen. In the original design, the riser neck and platform region froze too early, isolating the liquid pockets. Those isolated pockets became shrinkage casting defects.
$$G = \max \left( \frac{\partial T}{\partial x}, \frac{\partial T}{\partial y}, \frac{\partial T}{\partial z} \right)$$
I monitored temperature and solid fraction at multiple points in the casting. The thick sections cooled slowly, while the thin sections and mold-facing surfaces cooled quickly. In the original process, some points in the lower body finished solidification before the upper feeding zone had fully activated. This time lag is a classic cause of casting defects. When the feeding path closes, the remaining liquid contracts without compensation. The result is a cavity or a network of micro-porosity.
| Solidification Stage | Observed Behavior in Original Design | Risk of Casting Defects |
|---|---|---|
| Filling complete | About 2.4% solid fraction at edges and thin walls | Low immediate risk, but early skin formation |
| 20% solid fraction | Gating system began to freeze | Feeding path begins to restrict |
| 40–60% solid fraction | Solidification front moved inward | Hot spots formed near flange and riser base |
| 80–88% solid fraction | Last liquid concentrated below and beside risers | High risk of shrinkage cavities and porosity |
| 100% solid fraction | Total solidification time about 12,820 s | Defects remained as final casting defects |
The original simulation predicted four major shrinkage cavities and several dispersed porosity zones. The most severe casting defects were located near the flange-to-body transition and below the riser platform. The Niyama map showed large low-value regions in those areas. The predicted total defect volume was about 13% of the casting volume. This was unacceptable for a pressure-containing valve component. I then compared the simulation with actual production. The foundry cast the part using the original process, removed the gating and risers, cleaned the surface, and performed visual, magnetic particle, ultrasonic, and penetrant testing. The inspection revealed shrinkage cavities and porosity in the same regions predicted by simulation. This agreement confirmed that the model was capturing the dominant physics, even though some numerical uncertainty remained.
| Inspection Method | Purpose | Original Casting Result |
|---|---|---|
| Visual testing | Surface condition and gross defects | Minor surface irregularities after cleaning |
| Magnetic particle testing | Surface and near-surface casting defects | Indications near flange transition |
| Ultrasonic testing | Internal shrinkage and porosity | Shrinkage cavities and dispersed porosity |
| Penetrant testing | Surface-breaking defects | Local indications on machined surfaces |
The optimization strategy had two main parts. First, I improved the feeding system. I replaced ordinary sand risers with exothermic insulating risers. The four main risers received a 20 mm thick FT400-type exothermic sleeve. The five auxiliary risers used a double-layer insulating design, and I added insulating cover plates on top. These changes reduced heat loss from the riser surface and extended the time during which the riser remained liquid. As a result, the effective riser modulus increased. Using the approximate relationship for an insulating riser:
$$M_{eff} = \frac{M}{0.7} = 1.43M$$
This means that a riser with an insulating sleeve behaves as if it were about 43% larger in modulus than an unprotected sand riser. The feeding efficiency rises from roughly 12%–20% to 30%–60%. For a large steel casting with casting defects caused by insufficient feeding, this change is significant. It allows the riser to stay liquid longer, maintain an open feeding channel, and supply liquid metal to the last solidifying regions.
Second, I modified the chill design. The original chills were not sufficient to control the hot spots near the lower flange and internal cavity. I repositioned chills and adjusted their sizes directly on the pattern. The goal was to increase the cooling rate in thick sections and reduce the thermal gradient between the lower flange and the surrounding body. This promoted more uniform solidification and reduced the chance of isolated liquid pockets. In effect, the chills helped convert a poorly fed hot spot into a region that solidified earlier or in a more balanced way. This reduced casting defects near the flange and improved the overall temperature field.
| Optimization Measure | Original Condition | Improved Condition | Effect on Casting Defects |
|---|---|---|---|
| Main risers | Plain sand risers | Exothermic insulating sleeves, 20 mm | Extended feeding time and reduced shrinkage |
| Auxiliary risers | Plain sand risers | Double-layer insulation with cover plates | Reduced heat loss and improved feeding |
| Chill placement | Limited flange and cavity chills | Repositioned and resized chills | Reduced local hot spots and porosity |
| Riser top | Open or lightly covered | Insulating cover | Delayed top freezing |
| Feeding path | Sometimes closed early | Maintained to late solidification | Fewer shrinkage casting defects |
I rebuilt the optimized assembly and repeated the simulation. The filling time increased slightly to about 105 s because the gating system was unchanged but the thermal conditions were modified. The filling remained smooth, and no new filling-related casting defects appeared. The solidification sequence was markedly different. At 105 s, the solid fraction was about 15.6% at the edges, thin walls, and chill surfaces. By 642 s, the solid fraction reached about 33%. By 1913 s, it reached about 58.3%. The casting then solidified progressively from thin sections toward thick sections and finally toward the riser. At 7373 s, the solid fraction reached about 81.4%, and at 12,143 s it reached about 92%. The last liquid was located inside the insulating risers. This is exactly the condition I wanted. If the last liquid is in the riser, the riser can feed the casting and the final shrinkage cavity remains in the riser rather than in the component.
| Time, s | Solid Fraction, % | Location of Last Liquid | Casting Defect Risk |
|---|---|---|---|
| 105 | 15.6 | Edges, thin walls, chill contact zones | Low |
| 642 | 33.0 | Thin sections progressing inward | Low |
| 1913 | 58.3 | Transition from thin to thick sections | Moderate if feeding path closes |
| 4732 | 81.4 | Thick body and riser necks | Reduced by insulating risers |
| 7373 | 90.0 | Riser interiors | Low |
| 12143 | 92.0 | Mainly exothermic risers | Very low |
The temperature field confirmed the improvement. A vertical section through the riser showed a bottom-to-top temperature distribution. The lower part of the riser remained cooler than the upper part, but the insulating sleeve kept the entire riser hot enough to feed. The casting solidified directionally toward the risers. The chills created local gradients that eliminated the lower-body porosity. The Niyama prediction showed that almost all remaining casting defects were confined to the riser volume. Only a negligible amount appeared at the riser platform. The casting body itself was essentially free of harmful shrinkage defects.
Even after this improvement, I wanted to refine the process parameters. The optimized geometry was effective, but the pouring temperature, filling rate, and mold temperature still influenced the final result. To quantify their effects, I designed an orthogonal experiment. Orthogonal testing is efficient because it examines multiple factors with fewer runs than a full factorial experiment. I selected three factors: pouring temperature, pouring rate, and mold temperature. Each factor had three levels.
| Level | Factor A: Pouring Temperature, °C | Factor B: Pouring Rate, kg/s | Factor C: Mold Temperature, °C |
|---|---|---|---|
| 1 | 1580 | 100 | 20 |
| 2 | 1570 | 90 | 25 |
| 3 | 1560 | 105 | 30 |
I used an L9(3³) orthogonal array. The response variable was shrinkage porosity, expressed as a percentage of casting volume. Lower porosity means fewer casting defects. The nine simulation runs are summarized below.
| Run | A | B | C | Porosity, % |
|---|---|---|---|---|
| L1 | 1580 | 100 | 20 | 12.35 |
| L2 | 1580 | 90 | 25 | 11.37 |
| L3 | 1580 | 105 | 30 | 13.62 |
| L4 | 1570 | 90 | 30 | 10.38 |
| L5 | 1570 | 105 | 20 | 7.54 |
| L6 | 1570 | 100 | 25 | 9.99 |
| L7 | 1560 | 105 | 25 | 14.64 |
| L8 | 1560 | 100 | 30 | 11.65 |
| L9 | 1560 | 90 | 20 | 15.53 |
I analyzed the results using range analysis. For each factor and level, I calculated the sum \(K_i\), the mean \(k_i\), and the range \(R\). The range is the difference between the maximum and minimum mean response. A larger range means a stronger influence on casting defects.
$$K_i = \sum_{j=1}^{n} y_{ij}$$
$$k_i = \frac{K_i}{n}$$
$$R = \max(k_i) – \min(k_i)$$
| Statistic | A: Pouring Temperature | B: Pouring Rate | C: Mold Temperature |
|---|---|---|---|
| K1 | 37.52 | 37.37 | 33.99 |
| K2 | 27.91 | 30.56 | 37.28 |
| K3 | 41.82 | 39.14 | 35.80 |
| k1 | 12.50 | 12.46 | 11.33 |
| k2 | 9.30 | 10.19 | 12.43 |
| k3 | 13.94 | 13.05 | 11.93 |
| R | 4.64 | 2.86 | 1.10 |
The ranking was \(R_A \gt R_B \gt R_C\). Therefore, pouring temperature had the strongest effect on shrinkage porosity, followed by pouring rate, and then mold temperature. The best levels were A2, B1, and C1. This corresponds to a pouring temperature of 1570 °C, a pouring rate of 100 kg/s, and a mold temperature of 20 °C. I verified this combination with a final simulation. The predicted porosity dropped to about 6.9%, and the remaining casting defects were located entirely in the riser. The casting body showed no harmful shrinkage defects.
| Parameter | Optimal Value | Reason |
|---|---|---|
| Pouring temperature | 1570 °C | Balances fluidity and solidification shrinkage |
| Pouring rate | 100 kg/s | Maintains smooth filling without excessive erosion |
| Mold temperature | 20 °C | Stabilizes initial cooling and chill action |
I then moved to production validation. The foundry prepared the mold using the optimized pattern, installed the insulating sleeves and chills, melted and refined the WCB steel, and poured according to the optimized parameters. After cooling, the casting was cleaned, the gating and risers were removed, and the surfaces were prepared for inspection. The removed risers showed a dense, well-fed structure. The shrinkage cavity was confined to the riser top. The riser neck was sound. This visual evidence was consistent with the simulation. Ultrasonic testing, magnetic particle testing, visual testing, and penetrant testing revealed no harmful macroscopic casting defects in the casting body. The part met the specification. The actual result confirmed that the optimized process was effective.
| Validation Step | Result | Relation to Casting Defects |
|---|---|---|
| Mold preparation | Optimized chills and sleeves installed | Controlled local cooling and feeding |
| Melt preparation | WCB chemistry within specification | Reduced inclusion and gas-related casting defects |
| Pouring | 1570 °C, 100 kg/s | Stable filling and reduced shrinkage |
| Riser removal | Shrinkage confined to riser | Confirmed effective feeding |
| Non-destructive testing | No harmful macroscopic casting defects | Demonstrated process capability |
The economic effect was also important. The original yield was about 78%. After optimization, it rose to about 92%. The production cycle shortened from about 18 days to about 13.5 days. This reduced waste, increased capacity, and lowered energy consumption. I estimated the annual benefit for a production volume of 500 pieces. The scrap reduction alone saved a substantial amount. The shorter cycle allowed additional production. Energy consumption fell by about 15%. The following table summarizes the main economic results.
| Economic Factor | Original Condition | Optimized Condition | Annual Effect |
|---|---|---|---|
| Yield | 78% | 92% | 70 fewer rejected pieces |
| Production cycle | 18 days | 13.5 days | About 125 additional pieces |
| Energy use | Baseline | 15% lower | About 101,825 yuan saved |
| Scrap cost | High | Reduced | About 3.43 million yuan saved |
| New sales | Baseline | Higher capacity | About 20 million yuan potential |
| Quality premium | Baseline | 4% higher price | About 3.2 million yuan gain |
| Market share | Baseline | 10% more orders | About 8 million yuan potential |
I also applied the same simulation-based method to other castings, including a pump housing and a shell-type component. The steps were the same: three-dimensional modeling, mesh refinement, material assignment, boundary condition setup, filling simulation, solidification simulation, Niyama prediction, riser and chill optimization, and orthogonal parameter selection. In each case, the predicted casting defects were concentrated in the risers after optimization, and the casting body was clean. This showed that the method is not limited to one part. It is a general approach for reducing casting defects in complex steel castings.
From a theoretical perspective, the most important lesson is that casting defects are system-level responses. They cannot be eliminated by changing one variable in isolation. A riser may be large enough, but if the feeding path freezes early, shrinkage cavities still form. A chill may be placed correctly, but if the pouring temperature is too low, cold shuts or misruns may appear. A gating system may fill the mold smoothly, but if the temperature gradient is reversed, porosity may still occur. Therefore, I treated the mold, gating, risers, chills, and pouring parameters as one coupled system. ProCAST allowed me to see that system in motion. The simulation did not simply produce colorful pictures. It produced a quantitative map of where casting defects would form and why.
For future work, I would extend the model in three directions. First, I would improve the material database. The accuracy of thermophysical properties directly affects predicted casting defects. A more complete database for WCB steel, resin sand, insulating sleeves, and chill materials would reduce uncertainty. Second, I would add microstructural simulation. Macro-scale defect prediction is valuable, but grain size, dendrite arm spacing, and phase distribution also influence performance. A coupled macro-micro model would provide a fuller picture of casting quality. Third, I would integrate real-time sensor data from the foundry. Pouring temperature, mold temperature, and filling time can vary in production. A digital twin that updates with sensor data could predict casting defects more accurately and support real-time process control.
In summary, I developed a practical and effective method for controlling casting defects in top-entry ball valve steel castings. The original process produced shrinkage cavities and porosity because the feeding system could not maintain a continuous liquid path to the last solidifying regions. The optimized process used exothermic insulating risers, insulating covers, and repositioned chills to establish directional solidification. Orthogonal testing identified the best pouring parameters: 1570 °C pouring temperature, 100 kg/s pouring rate, and 20 °C mold temperature. Simulation and production both confirmed that the optimized process eliminated harmful casting defects from the casting body. The remaining shrinkage was confined to the risers, where it could be removed during cleaning. This work showed that simulation-based process optimization can reduce casting defects, shorten development time, lower cost, and improve the reliability of large steel castings.
The broader implication is that casting defects should be managed through design rather than inspection alone. Inspection can find casting defects, but it cannot prevent them. Simulation, when validated against production, can prevent them. It allows the engineer to test filling behavior, solidification sequence, feeding efficiency, and thermal gradients before the first mold is poured. In my work, this approach turned a difficult casting problem into a controlled manufacturing process. The same logic can be applied to other heavy-section steel castings, especially those used in valves, pumps, turbines, and pressure-containing equipment. With better material data, microstructural modeling, and digital twin integration, the ability to suppress casting defects will continue to improve.
| Stage | Main Action | Outcome | Casting Defects Status |
|---|---|---|---|
| Baseline design | Bottom gating, sand risers, limited chills | Smooth filling but poor feeding | Shrinkage cavities and porosity predicted and observed |
| First optimization | Insulating risers, covers, repositioned chills | Directional solidification improved | Most casting defects moved into riser |
| Orthogonal optimization | L9 tests on temperature, rate, mold temperature | Best parameters identified | Porosity reduced to about 6.9% |
| Production validation | Pouring with optimized parameters | No harmful macroscopic casting defects | Casting body clean; defects confined to riser |
| Economic evaluation | Yield, cycle, energy, and market analysis | Yield improved from 78% to 92% | Casting defects cost reduced substantially |
I conclude that the combination of sand casting theory, ProCAST simulation, orthogonal experimentation, and production verification is a robust framework for casting defect control. It is especially useful for large steel castings with thick sections, isolated hot spots, and complex feeding paths. The method does not rely on guesswork. It uses physics, data, and validation. For the top-entry ball valve casting, it converted a high-risk component into a reliable product. For future foundry practice, it offers a path toward lower scrap, shorter lead times, and higher confidence in casting quality.