
The pursuit of low-carbon manufacturing is a cornerstone of sustainable industrial development. Within this landscape, the foundry industry, as a fundamental supplier of metal components, faces significant challenges due to its traditionally high energy consumption and associated emissions. **Sand casting parts** represent a vast portion of the casting output, making the environmental optimization of their production processes critically important. Merely measuring total carbon emissions is insufficient for guiding effective improvement; a more nuanced metric that relates emissions to productive output and operational efficiency is required. This article, from our perspective, introduces and elaborates on a comprehensive Carbon Efficiency model specifically tailored for the **sand casting** process.
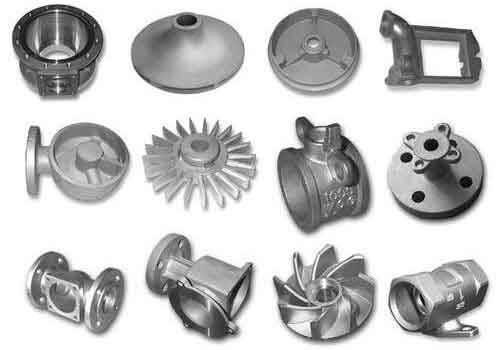
We define Carbon Efficiency for the **sand casting** process as the system’s inherent capability to minimize carbon emissions while maximizing production effectiveness, considering a holistic set of factors including production capacity, equipment utilization, resource input, and environmental impact. This moves beyond simple carbon intensity (emissions per economic output) to capture the multifaceted reality of the shop floor. To operationalize this definition, we must first establish a foundational model for quantifying emissions from the diverse sources within a **sand casting** production line.
Modeling Carbon Emissions Based on Process Carbon Sources
The **sand casting** process is a sequence of interconnected stages, each contributing to the total carbon footprint. We categorize emissions into five fundamental Process Carbon Sources (PCS), which are further grouped into two major types: Equipment Carbon Sources (\(C_{eq}\)) and Non-Equipment Carbon Sources (\(C_{neq}\)).
- Equipment Carbon Sources (\(C_{eq}\)): Emissions directly tied to machinery operation.
- Idle/Standby Carbon Source (\(C_{PC}\)): Emissions when equipment is powered on but not processing **sand casting parts**. Governed by idle power (\(P_o\)), operational time (\(t\)), and the carbon emission factor of electricity (\(E_e\)).
- Loaded Carbon Source (\(C_{LC}\)): Emissions during active processing. Depends on idle power, an additional load-dependent power term (\(P_w \cdot m_e\)), a loss coefficient (\(\mu\)), time, and \(E_e\).
- Non-Equipment Carbon Sources (\(C_{neq}\)): Emissions from materials, direct energy, and waste.
- Material Consumption Carbon Source (\(C_{MC}\)): From the production and processing of raw materials (sand, binders, etc.) used for **sand casting parts**.
- Energy Consumption Carbon Source (\(C_{EC}\)): From direct combustion of fuels (e.g., in melting).
- Non-Desired Output Carbon Source (\(C_{UC}\)): From the treatment of waste materials like used sand and slag.
The calculation models for these sources are summarized below:
Table 1: Calculation Models for Process Carbon Sources (PCS)
| Carbon Source Type | Primary Influencing Factors | Calculation Model |
|---|---|---|
| Idle/Standby (\(C_{PC}\)) | Idle power (\(P_o\)), Time (\(t\)) | $$C_{PC} = P_o \cdot t \cdot E_e$$ |
| Loaded (\(C_{LC}\)) | Idle power, Load mass (\(m_e\)), Load power coefficient (\(P_w\)), Loss coeff. (\(\mu\)), Time | $$C_{LC} = (P_o + \mu \cdot m_e \cdot P_w) \cdot t \cdot E_e$$ |
| Material (\(C_{MC}\)) | Quantity of material \(i\) consumed (\(U_i\)), Processing energy per stage \(k\) (\(ES_k\)) | $$C_{MC} = \sum_{i=1}^{n} \sum_{k=1}^{i} (ES_k \cdot U_i) \cdot E_e$$ |
| Direct Energy (\(C_{EC}\)) | Volume of energy type \(i\) consumed (\(V_i\)), Its emission factor (\(E_i\)) | $$C_{EC} = \sum_{i=1}^{n} V_i \cdot E_i$$ |
| Waste (\(C_{UC}\)) | Quantity of waste \(i\) generated (\(Q_i\)), Treatment difficulty factor (\(\phi_i\)), Processing energy (\(ES_k\)) | $$C_{UC} = \sum_{i=1}^{n} \sum_{k=1}^{i} (ES_k \cdot Q_i \cdot \phi_i) \cdot E_e$$ |
The total carbon emission (\(C_{pro}\)) for a **sand casting** production process, such as one producing a batch of specific **sand casting parts**, is the sum of all these sources:
$$C_{pro} = C_{eq} + C_{neq} = (C_{PC} + C_{LC}) + (C_{MC} + C_{EC} + C_{UC})$$
A Four-Dimensional Carbon Efficiency Model for Sand Casting
With the emission calculation foundation, we construct a multi-dimensional Carbon Efficiency (CE) model to evaluate the relationship between these emissions and key production performance indicators. The overall CE is a vector comprising four distinct but related dimensions:
$$CE = \{ CE_{cp},\ CE_{eq},\ CE_{e},\ CE_{t} \}$$
1. Production Capacity Carbon Efficiency (\(CE_{cp}\))
This dimension evaluates how efficiently carbon is emitted relative to the productive output of the line, whether measured in number of molds (for high-volume small **sand casting parts**) or tonnage of castings.
$$CE_{cp} = \frac{C_{eq} + C_{neq}}{CP} = \frac{(C_{PC}+C_{LC}) + (C_{MC}+C_{EC}+C_{UC})}{CP}$$
Where \(CP\) is the production capacity. Calculating \(CP\) requires aggregating capacities at different organizational levels (equipment, cell, line). For equipment and labor-centric stations, capacity is based on available time, efficiency, and standard cycle time. The total line capacity is an aggregation of these elemental capacities, considering bottlenecks in serial processes. A lower \(CE_{cp}\) indicates more output is generated per unit of carbon emitted.
2. Equipment Utilization Carbon Efficiency (\(CE_{eq}\))
This dimension focuses specifically on the efficiency of emissions from equipment sources relative to how effectively that equipment is used. It links equipment-related emissions directly to the Overall Equipment Effectiveness (OEE), which combines availability, performance rate, and quality rate.
$$CE_{eq} = \frac{\sum_{i=1}^{n}(C^i_{PC} + C^i_{LC})}{EP_{eq}}$$
Where \(EP_{eq}\) is the equipment productivity. For a machine or station \(i\):
$$EP_{eq}^i = \eta_{eq} \cdot \frac{N_{q}^i}{t_a^i \cdot t_{op}^i \cdot C_{dr}^i}$$
Here, \(N_q\) is the quantity of good **sand casting parts** produced, \(t_a\) is total time, \(t_{op}\) is operating time, \(C_{dr}\) is the design rate, and \(\eta_{eq}\) is the cyclic utilization. A high \(CE_{eq}\) suggests that equipment emissions are high relative to their useful output, pointing to potential inefficiencies like excessive idle time or low performance.
3. Energy Consumption Carbon Efficiency (\(CE_{e}\))
This dimension measures the proportion of total carbon emissions that originates from direct and indirect energy consumption (equipment + direct fuels). It highlights the energy-centric share of the carbon footprint.
$$CE_{e} = \frac{\sum_{i=1}^{n}(C^i_{LC} + C^i_{PC} + C^i_{EC})}{C_{pro}}$$
A value closer to 1 indicates that energy use is the dominant source of emissions for producing these **sand casting parts**, making energy conservation the primary lever for carbon reduction.
4. Production Cycle Carbon Efficiency (\(CE_{t}\))
This dimension assesses the carbon emission rate, relating the total emissions from producing a batch of **sand casting parts** to the total production cycle time.
$$CE_{t} = \frac{\sum_{i=1}^{n}(C^i_{LC} + C^i_{PC} + C^i_{MC} + C^i_{EC} + C^i_{UC})}{\sum_{j=1}^{m} \Delta_j}$$
Where \(\Delta_j\) is the duration of production cycle \(j\). A lower \(CE_t\) indicates a slower rate of carbon emission per unit time, which can be associated with a more controlled or less intensive process.
Table 2: Summary of the Four-Dimensional Carbon Efficiency Model
| Dimension | Focus | Key Formula | Interpretation |
|---|---|---|---|
| \(CE_{cp}\) | Output vs. Total Emissions | $$CE_{cp} = \frac{C_{pro}}{CP}$$ | Lower is better: more product per kg CO₂. |
| \(CE_{eq}\) | Equipment Emissions vs. OEE | $$CE_{eq} = \frac{\sum C_{eq}^i}{EP_{eq}}$$ | Lower is better: equipment is both productive and carbon-efficient. |
| \(CE_{e}\) | Energy’s Share of Emissions | $$CE_{e} = \frac{\sum (C_{eq}^i+C_{EC}^i)}{C_{pro}}$$ | High value indicates energy is the main carbon source. |
| \(CE_{t}\) | Emission Rate over Time | $$CE_{t} = \frac{C_{pro}}{\sum \Delta_j}$$ | Lower is better: slower carbon emission rate. |
Evaluating Carbon Efficiency Using Grey Relational Analysis
To compare and rank different **sand casting** process routes (e.g., different molding lines for the same part), we employ Grey Relational Analysis (GRA). This method is suitable for multi-criteria decision-making with limited information, precisely aligning with our four-dimensional CE vector.
Let there be \(m\) alternative process routes to evaluate. For each route \(j\), we calculate its four-dimensional CE vector: \([CE_{cp}^j, CE_{eq}^j, CE_{e}^j, CE_{t}^j]\). The evaluation steps are as follows:
Step 1: Construct the Ideal Matrix. From all \(m\) alternatives, select the optimal value for each of the four CE dimensions to form an ideal reference sequence \(P_0 = (p_0(1), p_0(2), p_0(3), p_0(4))\). Combine this with the alternatives to form the decision matrix \(D\).
Step 2: Normalize the Data. Since the four dimensions have different units and scales, normalization is required. For a benefit-type criterion (where lower is better, as with \(CE_{cp}\), \(CE_{eq}\), \(CE_t\)), we can use:
$$v_j(k) = \frac{\min_j x_j(k)}{x_j(k)}$$
For \(CE_e\), which indicates a share, normalization might follow a different pattern. This yields a normalized matrix \(V\).
Step 3: Calculate the Grey Relational Coefficient. This measures the proximity of each alternative’s normalized value to the ideal value for each dimension.
$$\psi_j(k) = \frac{\min\limits_j \min\limits_k |v_0(k) – v_j(k)| + \xi \max\limits_j \max\limits_k |v_0(k) – v_j(k)|}{|v_0(k) – v_j(k)| + \xi \max\limits_j \max\limits_k |v_0(k) – v_j(k)|}$$
Here, \(\xi\) is a distinguishing coefficient, typically set to 0.5. \(\psi_j(k)\) is the coefficient for alternative \(j\) on dimension \(k\).
Step 4: Compute the Weighted Grey Relational Grade. Assign weights \(w_k\) to each CE dimension based on strategic importance (e.g., using methods like AHP or entropy weighting). The overall grade for alternative \(j\) is:
$$\gamma_j = \sum_{k=1}^{4} w_k \cdot \psi_j(k)$$
Step 5: Rank the Alternatives. The process route with the highest grey relational grade \(\gamma_j\) has the carbon efficiency profile closest to the ideal and is thus ranked the best. This holistic ranking considers all four dimensions simultaneously, providing a more robust evaluation than comparing total emissions alone.
Synthesis and Practical Implications
The proposed modeling and evaluation framework provides a powerful lens through which foundries can assess and improve the sustainability of their operations for manufacturing **sand casting parts**. The transition from a singular focus on total carbon footprint to a multi-dimensional efficiency analysis reveals deeper insights. For instance, a process route with a moderately high total emission might still be the most carbon-efficient choice if it demonstrates superior production capacity (\(CE_{cp}\)) and equipment utilization (\(CE_{eq}\)). Conversely, a low-emission process might be inefficient if its output is very low.
This approach enables targeted improvement strategies. A high \(CE_{eq}\) signals a need to reduce equipment idle time or improve performance rates. A high \(CE_{e}\) directs efforts towards energy-saving technologies and alternative fuels. By regularly calculating these indices for different product lines or **sand casting parts**, management can identify best practices, set benchmarks, and make informed decisions on process optimization, technology investment, and production planning in the context of a low-carbon economy. Ultimately, integrating this carbon efficiency mindset is crucial for the **sand casting** industry to enhance its environmental stewardship while maintaining economic viability.