
In my extensive experience within the foundry industry, the lost foam casting process has emerged as a transformative technique for producing complex, high-integrity steel components, particularly for demanding structural applications. This article delves into the intricate details of employing the lost foam casting process to manufacture large-scale cast-steel nodes, such as cable clamps, using grades like G10MnMoV6-3 low-alloy steel. The lost foam casting process, characterized by its use of expandable polystyrene (EPS) patterns that vaporize upon metal pour, offers unparalleled design freedom and dimensional accuracy. I will share key technological insights, quality control protocols, and empirical data gathered from practical applications, emphasizing the critical role of the lost foam casting process throughout. The discussion will be enriched with tabular summaries and mathematical formulations to encapsulate the core principles.
The foundational step in any successful lost foam casting process is the creation of a precise foam pattern. For a component like a large cable clamp, the pattern must account for machining allowances and metallurgical shrinkage. The linear shrinkage allowance (SA) for steel can be expressed as a percentage of the nominal dimension. A common formula used in pattern design is:
$$ SA = L_0 \times \alpha $$
where \( L_0 \) is the original pattern dimension and \( \alpha \) is the linear shrinkage coefficient, typically ranging from 2.0% to 2.5% for low-alloy steels like G10MnMoV6-3. Therefore, the final pattern dimension \( L_p \) is calculated as:
$$ L_p = L_0 \times (1 + \alpha + \beta) $$
In this equation, \( \beta \) represents the machining allowance, which varies based on the surface finish required. For the cable clamp discussed, allowances of 15-20 mm were applied to critical surfaces. The lost foam casting process relies heavily on this precise pattern geometry, as any imperfection directly translates to the final casting.
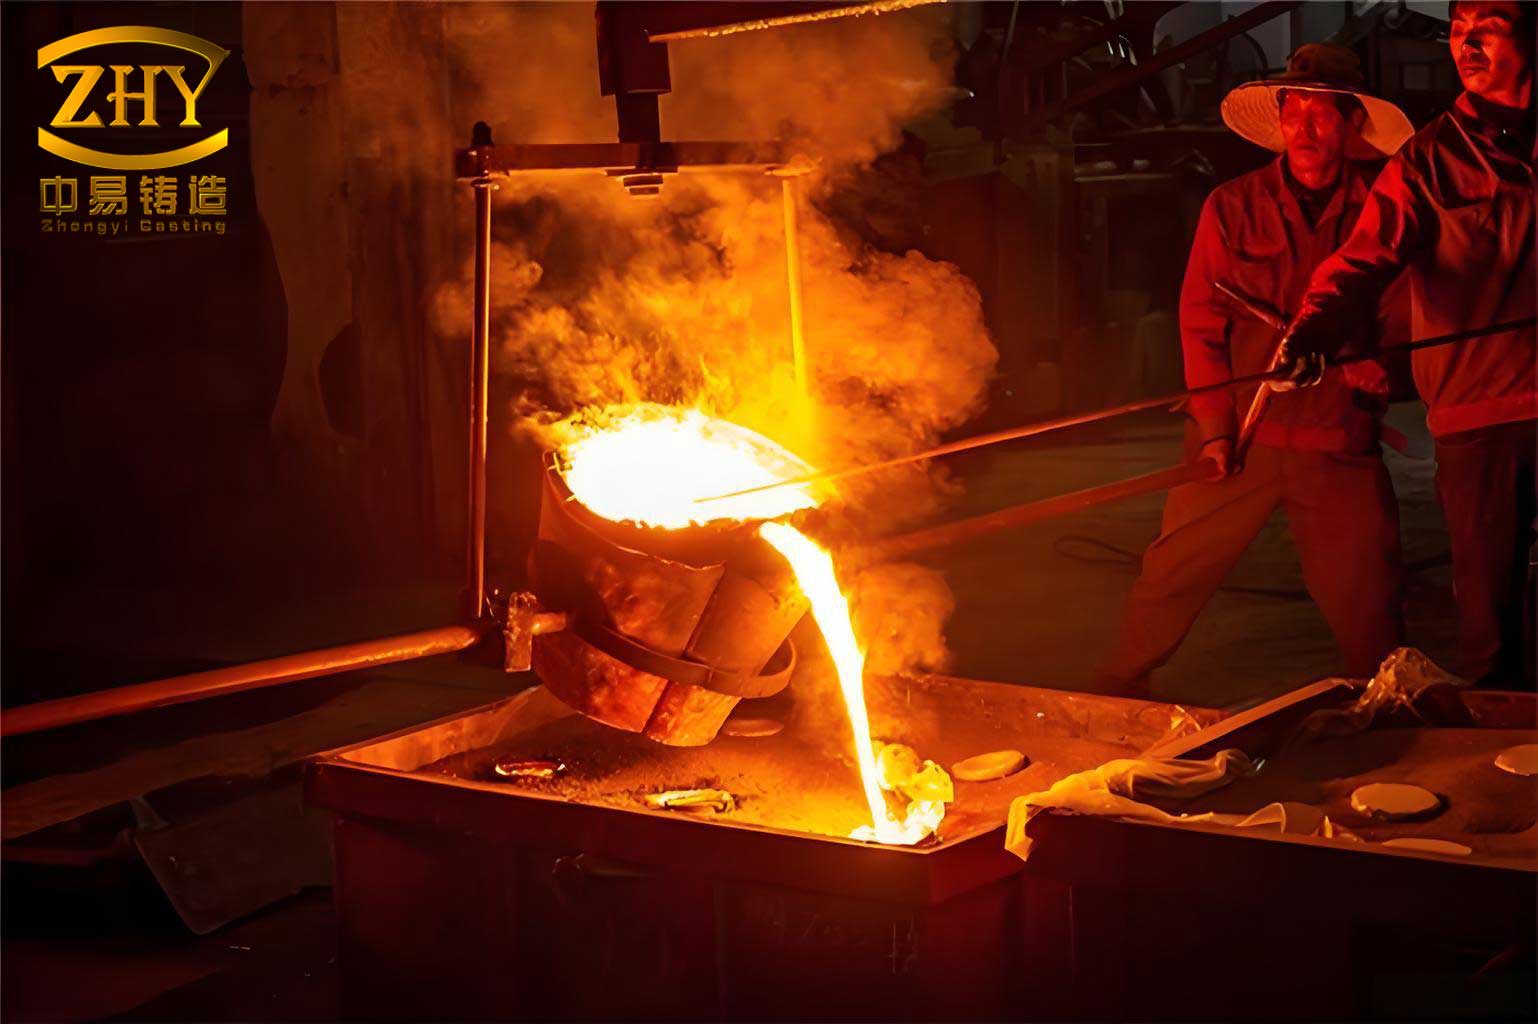
The image above provides a visual reference for the fundamental stages of the lost foam casting process, illustrating the pattern assembly, coating, sand filling, and metal pouring stages that are central to the discussion. After pattern creation, the application of a refractory coating is paramount. The coating thickness (CT) influences heat transfer and metal flow. An optimal range, often determined empirically, can be modeled by considering the slurry density (ρ_s) and viscosity (η). The coating’s drying process is critical to prevent gas defects, a common challenge in the lost foam casting process. The rate of gas evolution during pattern decomposition must be managed through proper venting and sand compaction. The sand filling and compaction process employs vibration to achieve a uniform bulk density (ρ_b). The dynamic pressure (P_d) during compaction can be approximated by:
$$ P_d = \frac{F_v}{A} $$
where \( F_v \) is the vibrational force and \( A \) is the area. Proper compaction ensures the mold retains its shape during the intense thermal load of the lost foam casting process.
Material selection and melt chemistry are the cornerstones of achieving the desired mechanical properties. For structural nodes requiring high weldability and strength, G10MnMoV6-3 is a preferred choice. Its chemical composition must be tightly controlled, as summarized in Table 1. The carbon equivalent (C_eq) is a crucial parameter for assessing weldability and hardenability, calculated using the International Institute of Welding (IIW) formula:
$$ C_{eq} = C + \frac{Mn}{6} + \frac{Cr + Mo + V}{5} + \frac{Ni + Cu}{15} $$
For G10MnMoV6-3, the target is to maintain \( C_{eq} \leq 0.49\% \) to ensure good weldability alongside high strength. Each element plays a specific role, and their interactions are complex. The effect of alloying elements on the ultimate tensile strength (UTS) can be empirically related through regression equations developed for low-alloy steels, though the precise coefficients vary with processing history.
| Element | Symbol | Target Range (wt.%) | Primary Function |
|---|---|---|---|
| Carbon | C | 0.08 – 0.10 | Base strength, hardenability |
| Silicon | Si | 0.35 – 0.45 | Deoxidizer, strength, fluidity |
| Manganese | Mn | 1.35 – 1.45 | Strength, hardenability, austenite stability |
| Phosphorus | P | ≤ 0.020 | Impurity (embrittlement) |
| Sulfur | S | ≤ 0.015 | Impurity (hot shortness) |
| Molybdenum | Mo | 0.25 – 0.32 | Hardenability, high-temperature strength |
| Vanadium | V | 0.065 – 0.075 | Grain refinement, precipitation strengthening |
| Iron | Fe | Balance | Matrix |
The melting practice in the lost foam casting process typically employs medium-frequency induction furnaces. Charge material selection is critical; using clean, low-residual scrap is non-negotiable. The superheat temperature (\( T_{sh} \)) is a key variable, defined as the amount by which the pouring temperature (\( T_p \)) exceeds the liquidus temperature (\( T_L \)):
$$ T_{sh} = T_p – T_L $$
For G10MnMoV6-3, \( T_L \) is approximately 1510°C. A superheat of 70-110°C is common to ensure proper fluidity for filling the complex cavity created by the vaporizing foam in the lost foam casting process. Deoxidation is performed using aluminum and rare earth additions, following the reaction stoichiometry. The amount of aluminum required for final deoxidation can be estimated based on the oxygen potential of the melt, though it is often controlled via experience-based additions per ton of metal.
The pouring stage is perhaps the most dynamic phase of the lost foam casting process. The metal front advances, causing the EPS pattern to thermally degrade. The rate of foam degradation and the subsequent gas pressure in the mold must be balanced by the metallostatic pressure and the applied vacuum in many modern systems. The pressure balance at the metal-foam interface can be simplified as:
$$ P_{metal} + P_{vac} \geq P_{gas} + P_{sand} $$
where \( P_{metal} = \rho_m g h \) is the metallostatic pressure, \( P_{vac} \) is the applied vacuum pressure, \( P_{gas} \) is the pressure from decomposed foam gases, and \( P_{sand} \) is the resistance of the sand mass. Inadequate pressure can lead to fold defects or incomplete filling. The pouring time (\( t_p \)) for a given volume (\( V \)) and gating system area (\( A_g \)) can be approximated using Bernoulli’s principle modified for viscous flow:
$$ t_p \approx \frac{V}{A_g \cdot v} $$
where \( v \) is the average flow velocity. Post-pouring, solidification begins. The solidification time (\( t_s \)) for a section of thickness (\( d \)) follows Chvorinov’s rule:
$$ t_s = B \cdot \left( \frac{V}{A} \right)^n $$
Here, \( B \) is the mold constant dependent on mold material and metal properties, \( V \) is the casting volume, \( A \) is its surface area, and \( n \) is an exponent often close to 2. Risers are designed using modulus methods to ensure directional solidification towards the feeder, a principle equally vital in the lost foam casting process as in conventional methods.
| Process Stage | Parameter | Typical Value / Range | Remarks |
|---|---|---|---|
| Pattern Making | Shrinkage Allowance (α) | 2.0 – 2.2 % | Material-dependent |
| Pattern Making | Machining Allowance (β) | 15 – 20 mm | For critical surfaces |
| Coating | Coating Thickness | 0.8 – 1.2 mm | Multiple layers, dried |
| Molding | Sand Bulk Density | 1.55 – 1.65 g/cm³ | After vibration compaction |
| Melting | Pouring Temperature (T_p) | 1570 – 1590 °C | For G10MnMoV6-3 |
| Melting | Deoxidation (Al) | 0.6 – 1.0 kg/ton | Final treatment |
| Pouring | Vacuum Pressure (P_vac) | 0.04 – 0.06 MPa | Applied during pour |
| Solidification | Riser Modulus (M_r) | > 1.2 * M_c | M_c is casting modulus |
After shakeout and cleaning, the as-cast microstructure is rarely optimal for mechanical properties. Heat treatment is thus an indispensable subsequent step. For G10MnMoV6-3, a quench and temper (Q&T) treatment is specified to achieve a tempered martensite or bainitic structure. The kinetics of phase transformation during heating and cooling are governed by diffusion. The time required for a certain phase transformation fraction at a constant temperature can be described by the Johnson-Mehl-Avrami-Kolmogorov (JMAK) equation:
$$ f = 1 – \exp(-k t^n) $$
where \( f \) is the transformed fraction, \( k \) is a rate constant dependent on temperature, \( t \) is time, and \( n \) is the Avrami exponent. In practice, continuous heating and cooling are used. The critical cooling rate to avoid ferrite/pearlite formation and form martensite, \( V_c \), must be exceeded during quenching. This rate is a function of the alloy’s hardenability, often assessed via ideal critical diameter (\( D_I \)) calculations. The tempering process relieves stresses and improves toughness. The tempering parameter (TP), such as the Hollomon-Jaffe parameter, helps correlate time and temperature effects on hardness:
$$ TP = T \cdot (\log t + C) $$
where \( T \) is absolute temperature in Kelvin, \( t \) is time in hours, and \( C \) is a constant. A standard Q&T cycle for a 150mm thick section of G10MnMoV6-3 might involve austenitizing at 950±15°C for 8 hours, followed by quenching in a polymer solution, and tempering at 650±10°C for 8-10 hours.
The success of the entire lost foam casting process is validated through rigorous mechanical testing. The relationship between yield strength (YS), ultimate tensile strength (UTS), and hardness (HB) for quenched and tempered low-alloy steels often follows empirical correlations. One such approximate relation is:
$$ \text{UTS (MPa)} \approx 3.45 \times \text{HB} $$
Furthermore, the impact toughness, measured by Charpy V-notch energy, is highly sensitive to microstructure and inclusion content. The ductile-to-brittle transition temperature (DBTT) must be kept well below the service temperature. The chemical composition and heat treatment parameters from the lost foam casting process directly influence this. Table 3 summarizes the achieved mechanical properties from a production batch, demonstrating the capability of the lost foam casting process when coupled with proper metallurgical control.
| Property | Symbol | Standard Requirement | Typical Achieved Range | Test Condition |
|---|---|---|---|---|
| Yield Strength | YS | ≥ 380 MPa | 460 – 520 MPa | 0.2% offset |
| Tensile Strength | UTS | 500 – 650 MPa | 580 – 620 MPa | |
| Elongation | A% | ≥ 18 % | 20 – 26 % | Gauge length 5.65√S₀ |
| Reduction of Area | Z% | – | 45 – 60 % | |
| Charpy Impact Energy | KV | ≥ 60 J | 80 – 120 J | +20°C |
| Brinell Hardness | HBW | – | 170 – 190 | 10/3000 |
Quality assurance in the lost foam casting process extends beyond chemistry and mechanical tests. Non-destructive testing (NDT) is vital. Ultrasonic testing (UT) relies on the reflection of sound waves from internal discontinuities. The amplitude of a reflected signal from a flaw compared to a reference reflector can be expressed in decibels (dB). Radiographic inspection follows the exponential attenuation law for X-rays or gamma rays:
$$ I = I_0 \exp(-\mu x) $$
where \( I \) is the transmitted intensity, \( I_0 \) is the incident intensity, \( \mu \) is the linear attenuation coefficient, and \( x \) is the material thickness. Defect acceptability is judged against standardized reference codes. Furthermore, statistical process control (SPC) is applied to key parameters of the lost foam casting process, such as pouring temperature, coating viscosity, and sand compactness, using control charts to monitor process stability.
One of the persistent challenges in the lost foam casting process is managing the gas evolution from the foam and its potential to cause porosity or carbonaceous residues. The mass of gas produced per unit volume of foam, \( m_g \), depends on the foam density (\( \rho_f \)) and its chemical composition. Ensuring adequate venting through the sand and coating permeability is essential. The permeability of the sand mold (\( K \)) can be estimated using Darcy’s law for flow through porous media, which is fundamental to designing the mold system in the lost foam casting process.
In conclusion, the production of high-integrity, large-scale steel castings like cable nodes via the lost foam casting process is a multidisciplinary endeavor requiring seamless integration of pattern engineering, metallurgy, fluid dynamics, and heat treatment science. The lost foam casting process offers distinct advantages in geometric complexity and dimensional consistency. However, its success is contingent upon meticulous control at every stage—from the precise calculation of pattern dimensions using shrinkage formulas, to the rigorous management of melt chemistry as shown in Table 1, to the optimization of pouring parameters to balance foam degradation and metal flow, and finally to the precise application of thermal cycles to develop the desired microstructure and properties. The data presented in the tables and the mathematical relationships discussed underscore the fact that the lost foam casting process is not merely an art but a quantifiable engineering discipline. When executed with precision, the lost foam casting process yields components that meet the most stringent international standards for structural applications, proving its viability as a leading manufacturing technology for critical infrastructure components.