
The lost foam casting process represents a significant evolution in metal forming technology, distinguished primarily by its unique mold-making and metal filling strategies. This process utilizes a foam pattern to define the casting cavity, which is subsequently replaced by molten metal. Compared to conventional sand casting, this method streamlines production, reduces material consumption, lowers labor intensity, and mitigates environmental impact. A critical quality metric for any casting, and particularly for components produced via lost foam casting, is surface roughness, which quantifies the microscopic irregularities of the surface texture. This article presents a detailed, first-person perspective analysis of the factors influencing surface roughness in lost foam castings, with a specific focus on the transfer of surface topography from the foam pattern through the refractory coating to the final metallic component. All measurements and analyses are conducted using non-contact three-dimensional optical profilometry, adhering to international standards for geometric product specification.
The core of this investigation lies in a comparative study of three interconnected surfaces within the lost foam casting process chain: the outer surface of the expanded polystyrene (EPS) foam pattern, the inner surface of the dried refractory coating shell that envelops the pattern, and the corresponding outer surface of the final ferrous casting. By quantitatively analyzing the three-dimensional topography and surface roughness parameters of these three stages, we can trace the evolution of surface features and identify the dominant controlling factors.
1. Measurement Methodology and Standards
The analysis was performed using a state-of-the-art non-contact 3D roughness profile optical analyzer. This instrument provides high-resolution three-dimensional mapping of surface topography without physically touching the sample, which is crucial for accurately measuring soft materials like foam and brittle coatings.
The measurement parameters were standardized across all samples to ensure comparability:
- Evaluation Length (L): $$L = 14.623 \text{ mm}$$
- Assessment Area (A): $$A = 1.7031 \text{ cm}^2$$
- Profile Cut-off Wavelength (Lc): $$L_c = 800 \mu\text{m}$$. This filter setting separates roughness from longer-wavelength waviness and form error.
Two primary sets of parameters were extracted, following the relevant ISO standards:
- Profile (Line) Roughness Parameters (ISO 4287): These are derived from a single line scan across the surface. The key parameter is the arithmetical mean deviation of the assessed profile, denoted as $$R_a$$.
- Areal (Surface) Roughness Parameters (ISO 25178): These provide a more comprehensive assessment by analyzing the entire measured area. The key parameter is the arithmetical mean height of the scale-limited surface, denoted as $$S_a$$.
In general, for a given surface, $$S_a$$ values are more representative of the overall texture and are typically larger than $$R_a$$ values, which represent a single, potentially idealized, line trace.
2. Surface Topography and Roughness Measurement Results
2.1 Expanded Polystyrene (EPS) Foam Pattern
The surface of an EPS pattern is formed by the fusion of individual pre-expanded beads. This structure inherently creates a textured surface. The degree of bead fusion, bead size consistency, and the presence of artifacts from the molding process (e.g., steam vent impressions) directly influence its initial roughness, which sets the starting point for the entire lost foam casting process.
| Parameter | Symbol | Value (μm) | Description |
|---|---|---|---|
| Arithmetical Mean Deviation | $$R_a$$ | 10.7171 | Average roughness |
| Root Mean Square Roughness | $$R_q$$ | 17.9264 | RMS roughness |
| Maximum Height of Profile | $$R_t$$ | 162.5866 | Total peak-to-valley height |
| Mean Height of Profile Elements | $$R_z$$ | 111.7564 | Average peak-to-valley height |
| Skewness | $$R_{sk}$$ | -2.7257 | Asymmetry of the profile |
| Kurtosis | $$R_{ku}$$ | 15.9665 | Peakedness of the profile |
| Parameter | Symbol | Value (μm) | Description |
|---|---|---|---|
| Arithmetical Mean Height | $$S_a$$ | 17.5004 | Average areal roughness |
| Root Mean Square Height | $$S_q$$ | 31.1781 | RMS areal roughness |
| Maximum Peak Height | $$S_p$$ | 444.4907 | Height of the highest peak |
| Maximum Valley Depth | $$S_v$$ | 543.8305 | Depth of the deepest valley |
| Maximum Height | $$S_z$$ | 988.3211 | $$S_p + S_v$$ |
| Areal Skewness | $$S_{sk}$$ | -4.1846 | Asymmetry of the surface height distribution |
| Areal Kurtosis | $$S_{ku}$$ | 36.0880 | Peakedness of the surface height distribution |
| Developed Interfacial Area Ratio | $$S_{dr}$$ | 55.76 % | Percentage of additional surface area compared to a perfectly flat plane |
The highly negative skewness ($$R_{sk}$$, $$S_{sk}$$) indicates a surface dominated by valleys, typical of the porous, fused-bead structure. The high kurtosis values suggest a spiky surface texture with extreme peaks and valleys.
2.2 Refractory Coating Shell Inner Surface
The application of a refractory water-based coating to the EPS pattern assembly is a critical step in lost foam casting. The coating must form a continuous, gas-permeable barrier. Its inner surface, formed in direct contact with the foam, replicates the pattern’s topography to a significant degree, albeit with modification due to the coating’s rheology and particle size.
| Parameter | Symbol | Value (μm) |
|---|---|---|
| $$R_a$$ | 5.8463 | |
| $$R_q$$ | 8.8044 | |
| $$R_t$$ | 81.2128 | |
| $$R_z$$ | 54.8141 | |
| $$R_{sk}$$ | -1.8161 | |
| $$R_{ku}$$ | 10.4843 |
| Parameter | Symbol | Value (μm) |
|---|---|---|
| $$S_a$$ | 9.4765 | |
| $$S_q$$ | 14.9826 | |
| $$S_z$$ | 473.0479 | |
| $$S_{sk}$$ | -2.1764 | |
| $$S_{ku}$$ | 21.8742 | |
| $$S_{dr}$$ | 15.6054 % |
A key observation is the substantial reduction in all roughness parameters compared to the EPS foam. The $$S_a$$ value decreases from 17.5004 μm to 9.4765 μm. The coating effectively smooths the surface by filling the deep valleys between EPS beads, significantly reducing the developed interfacial area ratio ($$S_{dr}$$) from 55.76% to 15.61%.
2.3 Ferrous Casting Outer Surface
The final surface of the lost foam casting is formed when molten metal fills the cavity left by the vaporized foam, replicating the inner contour of the coating shell. The metal’s fluidity, solidification behavior, and interfacial interaction with the coating determine the fidelity of this replication.
| Parameter | Symbol | Value (μm) |
|---|---|---|
| $$R_a$$ | 5.9235 | |
| $$R_q$$ | 7.7227 | |
| $$R_t$$ | 54.2705 | |
| $$R_z$$ | 41.1283 | |
| $$R_{sk}$$ | -0.5888 | |
| $$R_{ku}$$ | 4.1145 |
| Parameter | Symbol | Value (μm) |
|---|---|---|
| $$S_a$$ | 10.1398 | |
| $$S_q$$ | 14.6012 | |
| $$S_z$$ | 214.9686 | |
| $$S_{sk}$$ | -0.3602 | |
| $$S_{ku}$$ | 7.1656 | |
| $$S_{dr}$$ | 12.7092 % |
2.4 Comparative Analysis and Dominant Factor Identification
The most revealing insight comes from a direct comparison of the primary roughness parameters for the three surfaces involved in the lost foam casting process.
| Surface | Profile Roughness $$R_a$$ (μm) | Areal Roughness $$S_a$$ (μm) |
|---|---|---|
| EPS Foam Pattern (Outer) | 10.7171 | 17.5004 |
| Coating Shell (Inner) | 5.8463 | 9.4765 |
| Ferrous Casting (Outer) | 5.9235 | 10.1398 |
To quantify the change, we can define a Roughness Transfer Ratio between successive stages. For areal roughness from Coating to Casting:
$$
\text{Transfer Ratio}_{S_a} = \frac{S_{a,\text{Casting}}}{S_{a,\text{Coating}}} = \frac{10.1398}{9.4765} \approx 1.07
$$
This ratio is remarkably close to 1, indicating near-direct replication. In contrast, the ratio from Foam to Coating is:
$$
\frac{S_{a,\text{Coating}}}{S_{a,\text{Foam}}} = \frac{9.4765}{17.5004} \approx 0.54
$$
showing a 46% smoothing effect. Therefore, while the initial EPS foam pattern roughness has a foundational influence, the data conclusively demonstrates that the three-dimensional topography of the refractory coating shell’s inner surface is the primary and direct determinant of the final surface roughness in lost foam casting. The metal surface roughness values are far more closely aligned with those of the coating than with the original foam.
3. The Role of Contact Angle in Lost Foam Casting Surface Formation
Beyond mere geometric replication, the quality of surface formation in lost foam casting is governed by interfacial phenomena, quantified by contact angles at two critical junctures.
3.1 Coating-to-Foam Contact Angle (Room Temperature)
The wetting behavior of the refractory coating on the EPS foam pattern is crucial for forming a uniform, defect-free coating layer. A low contact angle (θ < 90°) indicates good wettability, promoting complete coverage and a smooth coating surface that faithfully replicates the underlying foam texture without bridging gaps.
Measurement of a water-based lost foam coating on an EPS substrate showed an initial contact angle of 101.0°, which rapidly decreased and stabilized at $$θ = 51.4°$$. This final angle signifies favorable wetting. For comparison, the contact angle of pure water on EPS is approximately 87.3°. The reduction is attributed to surfactants and binders in the coating formulation which lower the effective surface tension (γ) of the slurry. We can estimate this using the Young’s equation in a simplified form, considering the dominant forces:
$$
\cos θ \propto \frac{1}{γ}
$$
A lower coating surface tension leads to a smaller θ, enhancing coverage. Complete coverage is essential for ensuring that the coating shell’s inner surface is a continuous impression of the foam, which is the principal factor for final cast surface quality in lost foam casting.
3.2 Metal-to-Coating Contact Angle (High Temperature)
During the pouring stage of lost foam casting, the molten metal interacts with the coating shell. The wetting behavior here is ideally opposite to that of the coating on foam. A high contact angle (α > 90°) indicates poor wettability, meaning the liquid metal does not readily spread over or penetrate into the coating’s microscopic pores. This non-wetting characteristic is desirable to prevent metal penetration, which would cause a rough, sintered surface finish and make the casting difficult to separate from the sand mold.
An experiment simulating the interaction between molten cast iron and the coating shell under process-representative vacuum and temperature conditions revealed a contact angle of $$α = 120.9°$$. This obtuse angle confirms poor wettability. The relationship can be conceptually framed by considering the balance of surface energies at the metal-coating-vapor interface. A high α minimizes the work of adhesion ($$W_a$$) between the metal and the coating:
$$
W_a = γ_{lv}(1 + \cos α)
$$
where $$γ_{lv}$$ is the surface tension of the liquid metal. With α > 90°, cos α is negative, leading to a lower $$W_a$$. This minimizes the tendency for the metal to adhere to or infiltrate the coating, allowing the metal surface to solidify by freely conforming to the coating’s geometry without bonding. This non-wetting condition is thus critical for achieving a clean cast surface that accurately reflects the topography of the coating shell in the lost foam casting process.
4. Discussion: Three-Dimensional Topography Transfer and Implications
The process of lost foam casting can be modeled as a chain of surface topography transfer. The final casting surface roughness ($$S_{a, casting}$$) is not a simple function of the initial foam roughness ($$S_{a, foam}$$), but is mediated by the coating process.
We can propose a simplified relationship:
$$
S_{a, casting} = f( S_{a, coating} ) \approx k \cdot S_{a, coating}
$$
where the factor $$k$$ (found here to be ~1.07) represents the fidelity of replication from coating to metal. This factor is influenced by the metal’s fluidity, solidification shrinkage, and the high-temperature contact angle (α). The primary relationship is:
$$
S_{a, coating} = g( S_{a, foam}, η, d_{50}, θ )
$$
where $$g$$ is a function describing the coating’s smoothing action, dependent on the foam’s initial roughness ($$S_{a, foam}$$), the coating slurry’s viscosity (η), the median particle size of the refractory flour ($$d_{50}$$), and the coating-foam contact angle (θ). The significant reduction in $$S_{dr}$$ from foam to coating (55.76% to 15.61%) visually encapsulates this smoothing effect; the coating fills in the complex, porous network of the fused beads.
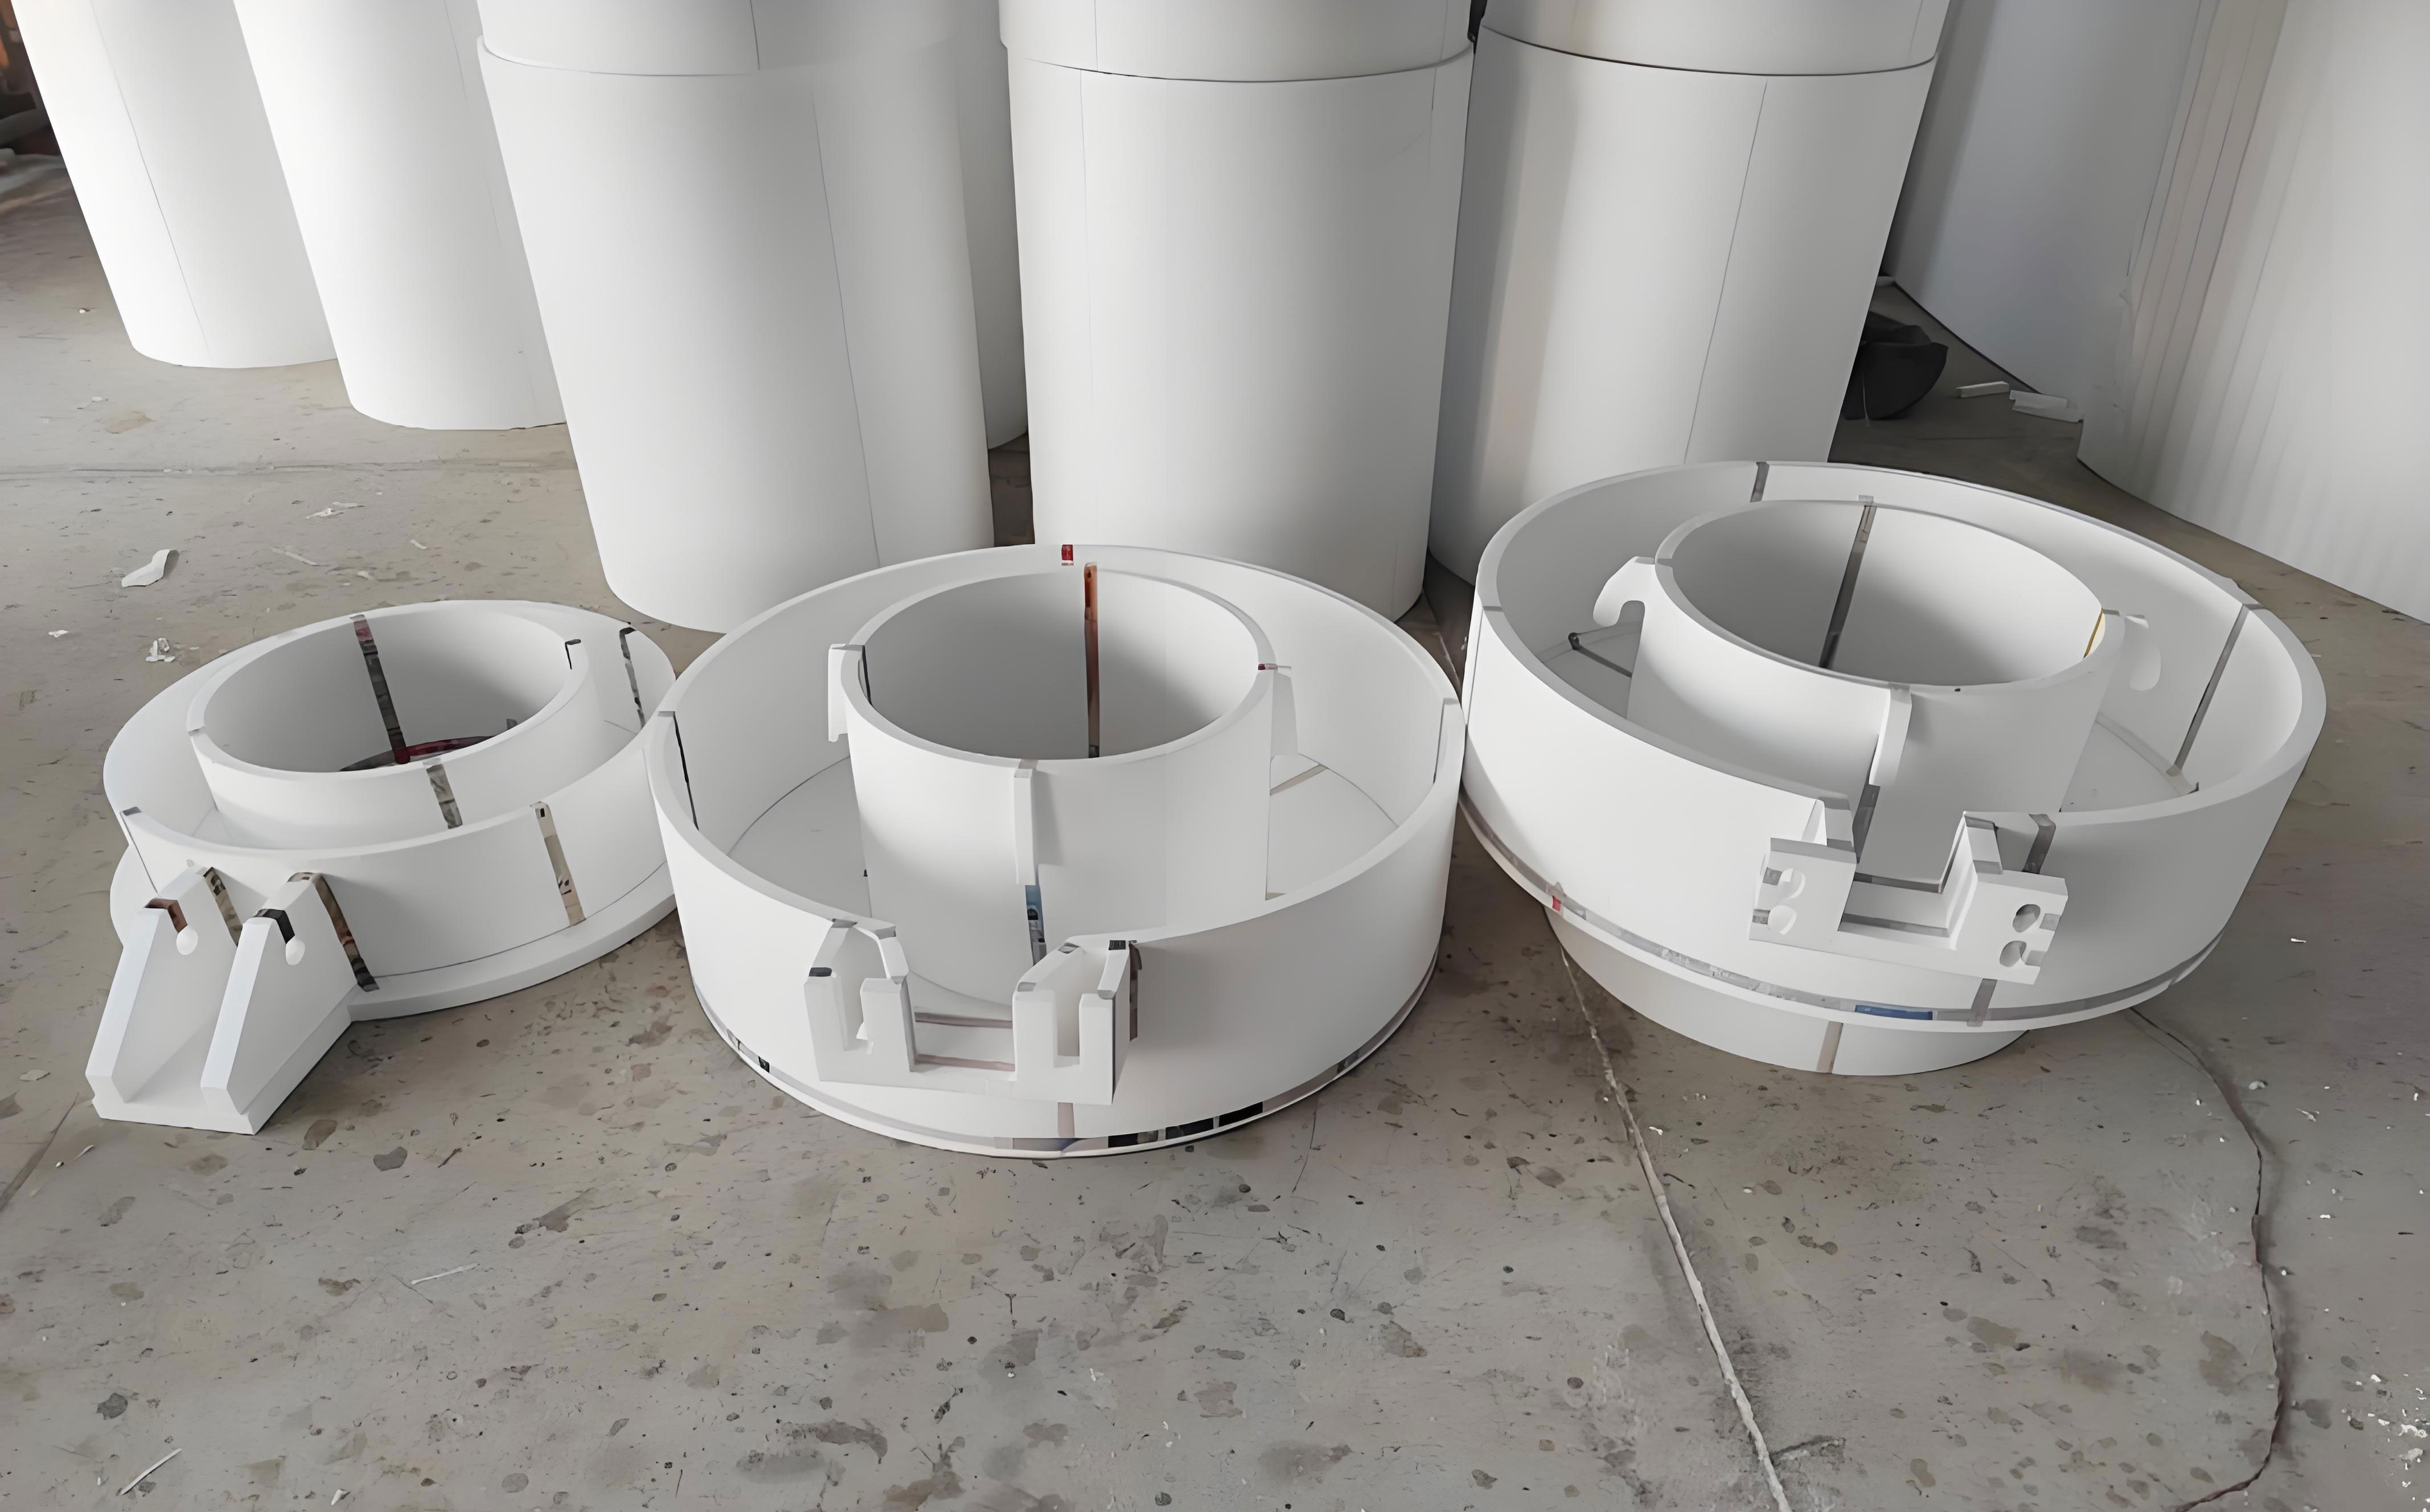
The three-dimensional visualization of these surfaces is instrumental in understanding this transfer. The foam shows a chaotic, valley-dominated landscape. The coating surface reveals a muted version of this landscape, where peaks are rounded and valleys are partially filled. The final cast metal surface strikingly resembles the coating’s topography more than the foam’s, featuring similar spatial wavelengths and peak distributions, albeit with the distinct metallic solidification microstructure superimposed at a much smaller scale.
This has direct practical implications for controlling surface quality in lost foam casting:
- Pattern Quality is Foundational: A smoother EPS pattern (lower $$S_a$$) provides a better starting point, as it requires less smoothing from the coating.
- Coating Formulation and Application are Paramount: Since the coating shell’s inner surface is the dominant factor, optimizing coating rheology for excellent wettability (low θ) and leveling is critical. Furthermore, the coating must be designed and fired to present a non-wetting surface to the molten metal (high α).
- Process Windows: Pouring temperature and vacuum pressure must be controlled to ensure the metal has sufficient fluidity to replicate the coating’s contours without causing degradation or erosion of the coating itself, which would adversely affect the lost foam casting’s surface.
5. Conclusion
This detailed investigation into surface roughness in lost foam casting, employing high-resolution 3D optical profilometry, establishes a clear quantitative chain of causality. While the initial roughness of the EPS foam pattern sets the baseline and influences the process, the three-dimensional topography of the refractory coating shell’s inner surface is identified as the primary and direct determinant of the final casting’s surface roughness. The measured areal roughness $$S_a$$ values of the coating (9.4765 μm) and the casting (10.1398 μm) are in close agreement, confirming a high-fidelity replication at the metal-coating interface.
The interfacial science governing this process is encapsulated by two key contact angles: a low room-temperature contact angle (θ ≈ 51.4°) ensures the coating adequately wets and uniformly covers the foam pattern, and a high high-temperature contact angle (α ≈ 120.9°) ensures the molten metal does not wet or infiltrate the coating, allowing for clean separation and accurate surface reproduction. Therefore, to achieve superior surface finish in lost foam casting, process optimization must focus decisively on refining the quality and properties of the refractory coating—its ability to smooth the foam pattern and its non-wetting behavior towards the molten metal. Controlling these factors is essential for harnessing the full potential of the lost foam casting process for producing high-integrity, dimensionally accurate, and fine-surfaced cast components.