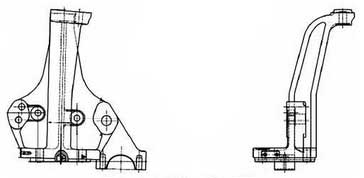
The support plate is a part of the truck suspension part, also known as the support arm, connecting plate, etc. its main function is to support and connect. Its two-dimensional plan is shown in Figure 1. The parts are similar to sails from the front and human arms from the side, with a height of 420mm, a bottom width of 312mm and a thickness of 88mm. Due to the special shape of the support plate, QT500-7 ductile iron is used for EPC casting. The casting technology requires that the workpiece should not have casting defects such as shrinkage cavity, shrinkage porosity and porosity. A supporting plate cracked after 2 months of service. The main content of this paper is to find the root cause of the cracking of the support plate through physical and chemical testing and SEM analysis, and take corresponding improvement measures to solve the problem of early cracking failure.
1.Fracture position and macromorphology

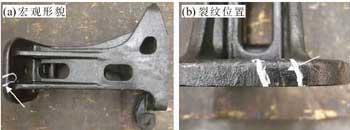
The solid parts of the support plate are shown in Fig. 2 (a). The crack is located at the lower bottom of the support plate and at the transition part of r8mm arc (Fig. 2 (b)). The length of the crack is about 22 mm. During the routine inspection after two months’ driving, it is found that there is a crack in this part. According to CAE analysis, the stress in this area is not very large. Cut the crack with saw machine, because the crack is too shallow, the fracture formed by the crack can not be opened, only the crack can be sampled at the crack position perpendicular to the crack, then inlaid, polished, corroded with 4% nitric alcohol, and observed the crack morphology.
2.Physical and chemical inspection of fracture

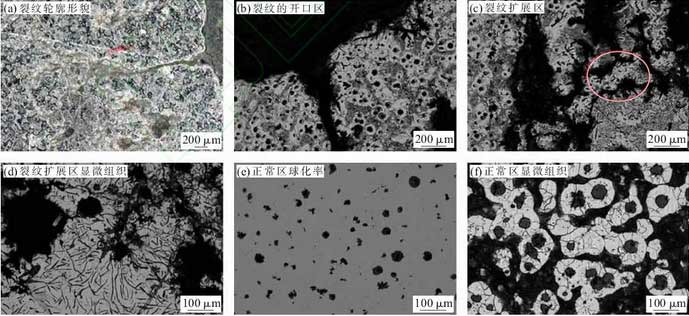
Fig. 3 (a) is a micrograph perpendicular to the crack. The crack is V-shaped with a depth of about 2.8mm , first crack from the surface and expand inward. Fig. 3 (b) is a metallographic picture of the crack opening taken with Axio OBERVER a1m Zeiss metallographic microscope. It can be seen from the figure that the graphite spheroidization is good at the place far away from the crack, while the graphite on both sides of the crack is more A-type graphite and a small amount of C-type graphite. Fig. 3 (c) is a metallographic picture of the crack propagating inward, and Fig. 3 (d) is an enlarged appearance of the elliptical region in Fig. 3 (c). It can be seen that the black abnormal structure in this region is surrounded by clear linear graphite distribution, and the crack always propagates along the black abnormal structure. It is necessary to further analyze the composition of the black abnormal structure in the subsequent detection.
The support plate is made of QT500-7 ductile iron with good casting performance. When there is no crack on the bottom, the gauge length is L = 25 mm, d0 = graphite iron, when there is no crack on the bottom, the gauge length is L = 25 mm, d0 = graphite iron, when there is no crack on the bottom, the gauge length is L = 25 mm, d0 = quasi 5 mm tensile sample and 25 mm × 25 mm × 15 mm hardness sample. Hdw-100 universal material testing machine was used for tensile testing, and hb-3000c Brinell hardness tester was used for hardness testing. Technical requirements: hardness 170-215 HBW, tensile strength ≥ 500 MPa, yield strength ≥ 320MPa, elongation ≥ 7%.
Take a 12mm × 20mm × 20mm metallographic sample in the crack free area, and inspect it according to GB / t13298-2015 metallic metallographic structure inspection method. Fig. 3 (E) is a picture of spheroidization rate, compared with the spheroidization classification chart in GB / t9441-2009 metallographic examination of nodular cast iron, the spheroidization rate can be rated as grade 3; FIG. 3 (f) is a picture of microstructure, dark gray is pearlite, white is ferrite, and spheroid is graphite, which is in accordance with GB / t9441-2009 The pearlite accounts for about 25% of the total, and the microstructure meets the technical requirements.
3.Micro morphology and energy spectrum analysis of fracture

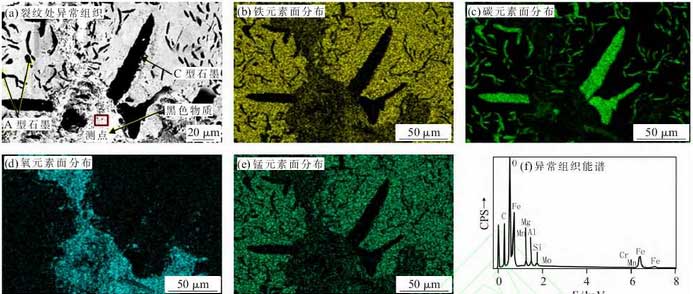
The abnormal tissues in Fig. 3 (c) were scanned with Zeiss evo18 scanning electron microscope, and the results are shown in Fig. 4 (a). It can be seen from the figure that there are more A-type graphite and wider C-type graphite. The black abnormal structure is bright in the secondary electron image, which has obvious charge effect, indicating that the material in this area is not conductive. Carry out element surface scanning in this area, and see Fig. 4 (b) – (E) for the surface distribution of iron, carbon, oxygen and manganese; from Fig. 4 (b) and Fig. 4 (E), it can be seen that the location of abnormal structure distribution is dim, indicating that there are less iron and manganese in this location; from Fig 4 (c) can be seen that the carbon element corresponding to graphite is relatively bright, while the carbon element in the abnormal tissue area also has local bright spots, indicating the distribution of carbon element in this area; from Figure 4 (d), it can be seen that the oxygen element is relatively bright, indicating that there are more oxygen elements. The energy spectrum analysis of the abnormal area is carried out in the box position of Fig. 4 → SPC (a). As shown in Fig. 4 (f), the two elements oxygen and carbon have higher diffraction peaks, indicating that the two elements above are more than the two elements above. It can also be seen from the surface scanning that there are no holes in the surface scanning of the abnormal tissue area and no dendrites in the microstructure, which indicates that this position is not shrinkage cavity.
