
In the context of global climate change and the urgent need for carbon emission reduction, the manufacturing sector has become a central focus for sustainable development. Among manufacturing processes, sand casting is a fundamental and widely used method for producing metal components. However, the sand casting industry faces significant challenges regarding high energy consumption and carbon dioxide emissions. My research aims to address these challenges by investigating a low-carbon matching design approach for sand casting production, specifically considering the influence of casting structure and production batch. This study focuses on the interplay between typical molding processes and melting equipment, aiming to establish a comprehensive model that can guide foundries toward more environmentally friendly and economically viable production strategies.
The core of this work lies in analyzing the production characteristics of different casting processes and melting equipment. I consider traditional sand molding, sand 3D printing molding, and a composite molding approach alongside melting equipment such as coke-fired cupolas, induction furnaces, natural gas cupolas, and natural gas rotary furnaces. By examining the material flows, energy consumption, and non-desired outputs at each production stage — including molding, melting, pouring, and post-processing — I construct an emission model that relates casting features and batch sizes to carbon footprint and production cost. The ultimate goal is to offer a practical decision-making tool for foundries that wish to minimize both environmental impact and operational expenses.
Research has shown that while traditional casting remains the backbone of many foundries, newer technologies such as sand 3D printing and composite molding can substantially reduce resource consumption and emissions when applied to suitable casting geometries. Similarly, the choice of melting furnace greatly affects the overall environmental burden. Natural-gas-fired furnaces typically yield lower emissions than coke-based systems, but their production capacity and cost structure differ. Therefore, a systematic matching of molding technique and melting furnace based on the actual casting structure and required batch size is essential for achieving meaningful emission reductions.
In this article, I present a structured approach to model the carbon emissions of sand casting production. I begin with an analysis of typical molding processes and melting equipment, followed by the development of a regression-based emission impact model using k-means clustering and ridge regression. Subsequently, I integrate these findings into a holistic carbon emission and cost model for sand casting. Finally, I validate the proposed low-carbon matching design with a practical case study of an industrial furnace cover casting. The results demonstrate that a carefully selected combination of production methods can reduce carbon emissions by more than 36% and total cost by about 32% compared with a conventional production scheme.
Analysis of Molding Processes and Melting Equipment
Sand casting production is generally divided into four stages: molding, melting, pouring, and post-processing. The molding stage involves making the mold, mixing sand, compacting, creating the mold cavity, and assembling the cores. The melting stage is responsible for converting metal charge materials into liquid. The pouring stage fills the mold with molten metal, and the post-processing stage includes shakeout, cleaning, and finishing operations. Each of these stages contributes to the total carbon footprint through material consumption, energy usage, and the handling of waste streams.
Three molding processes are considered in this research: traditional molding, sand 3D printing molding, and composite molding. Traditional molding relies on physical patterns and sand compaction. It is cost-effective for large volumes and simple geometries but requires significant pattern-making effort and storage space. Sand 3D printing uses a binder jetting process to create molds directly from digital models, eliminating the need for patterns and enabling complex geometries with high precision. However, the printing equipment and consumables currently make the process more expensive per unit, especially for large batches. Composite molding strategically combines both techniques — using additive manufacturing for complex regions while utilizing traditional methods for simpler, less critical parts — thereby balancing cost and efficiency.
Melting equipment also varies significantly in emission profiles. I analyze four types: coke-fired cupola, induction electric furnace, natural gas cupola, and natural gas rotary furnace. The coke-fired cupola is traditional and powerful, but it generates large amounts of carbon dioxide and requires heavy pollution control equipment. Induction furnaces use electricity, offering precise temperature control and clean operation, yet the indirect emissions from electricity generation often make them carbon-intensive. Natural gas cupolas and rotary furnaces are cleaner alternatives, with lower CO₂ emissions and simpler waste gas treatment, but their melting rates are typically lower than those of large cupolas.
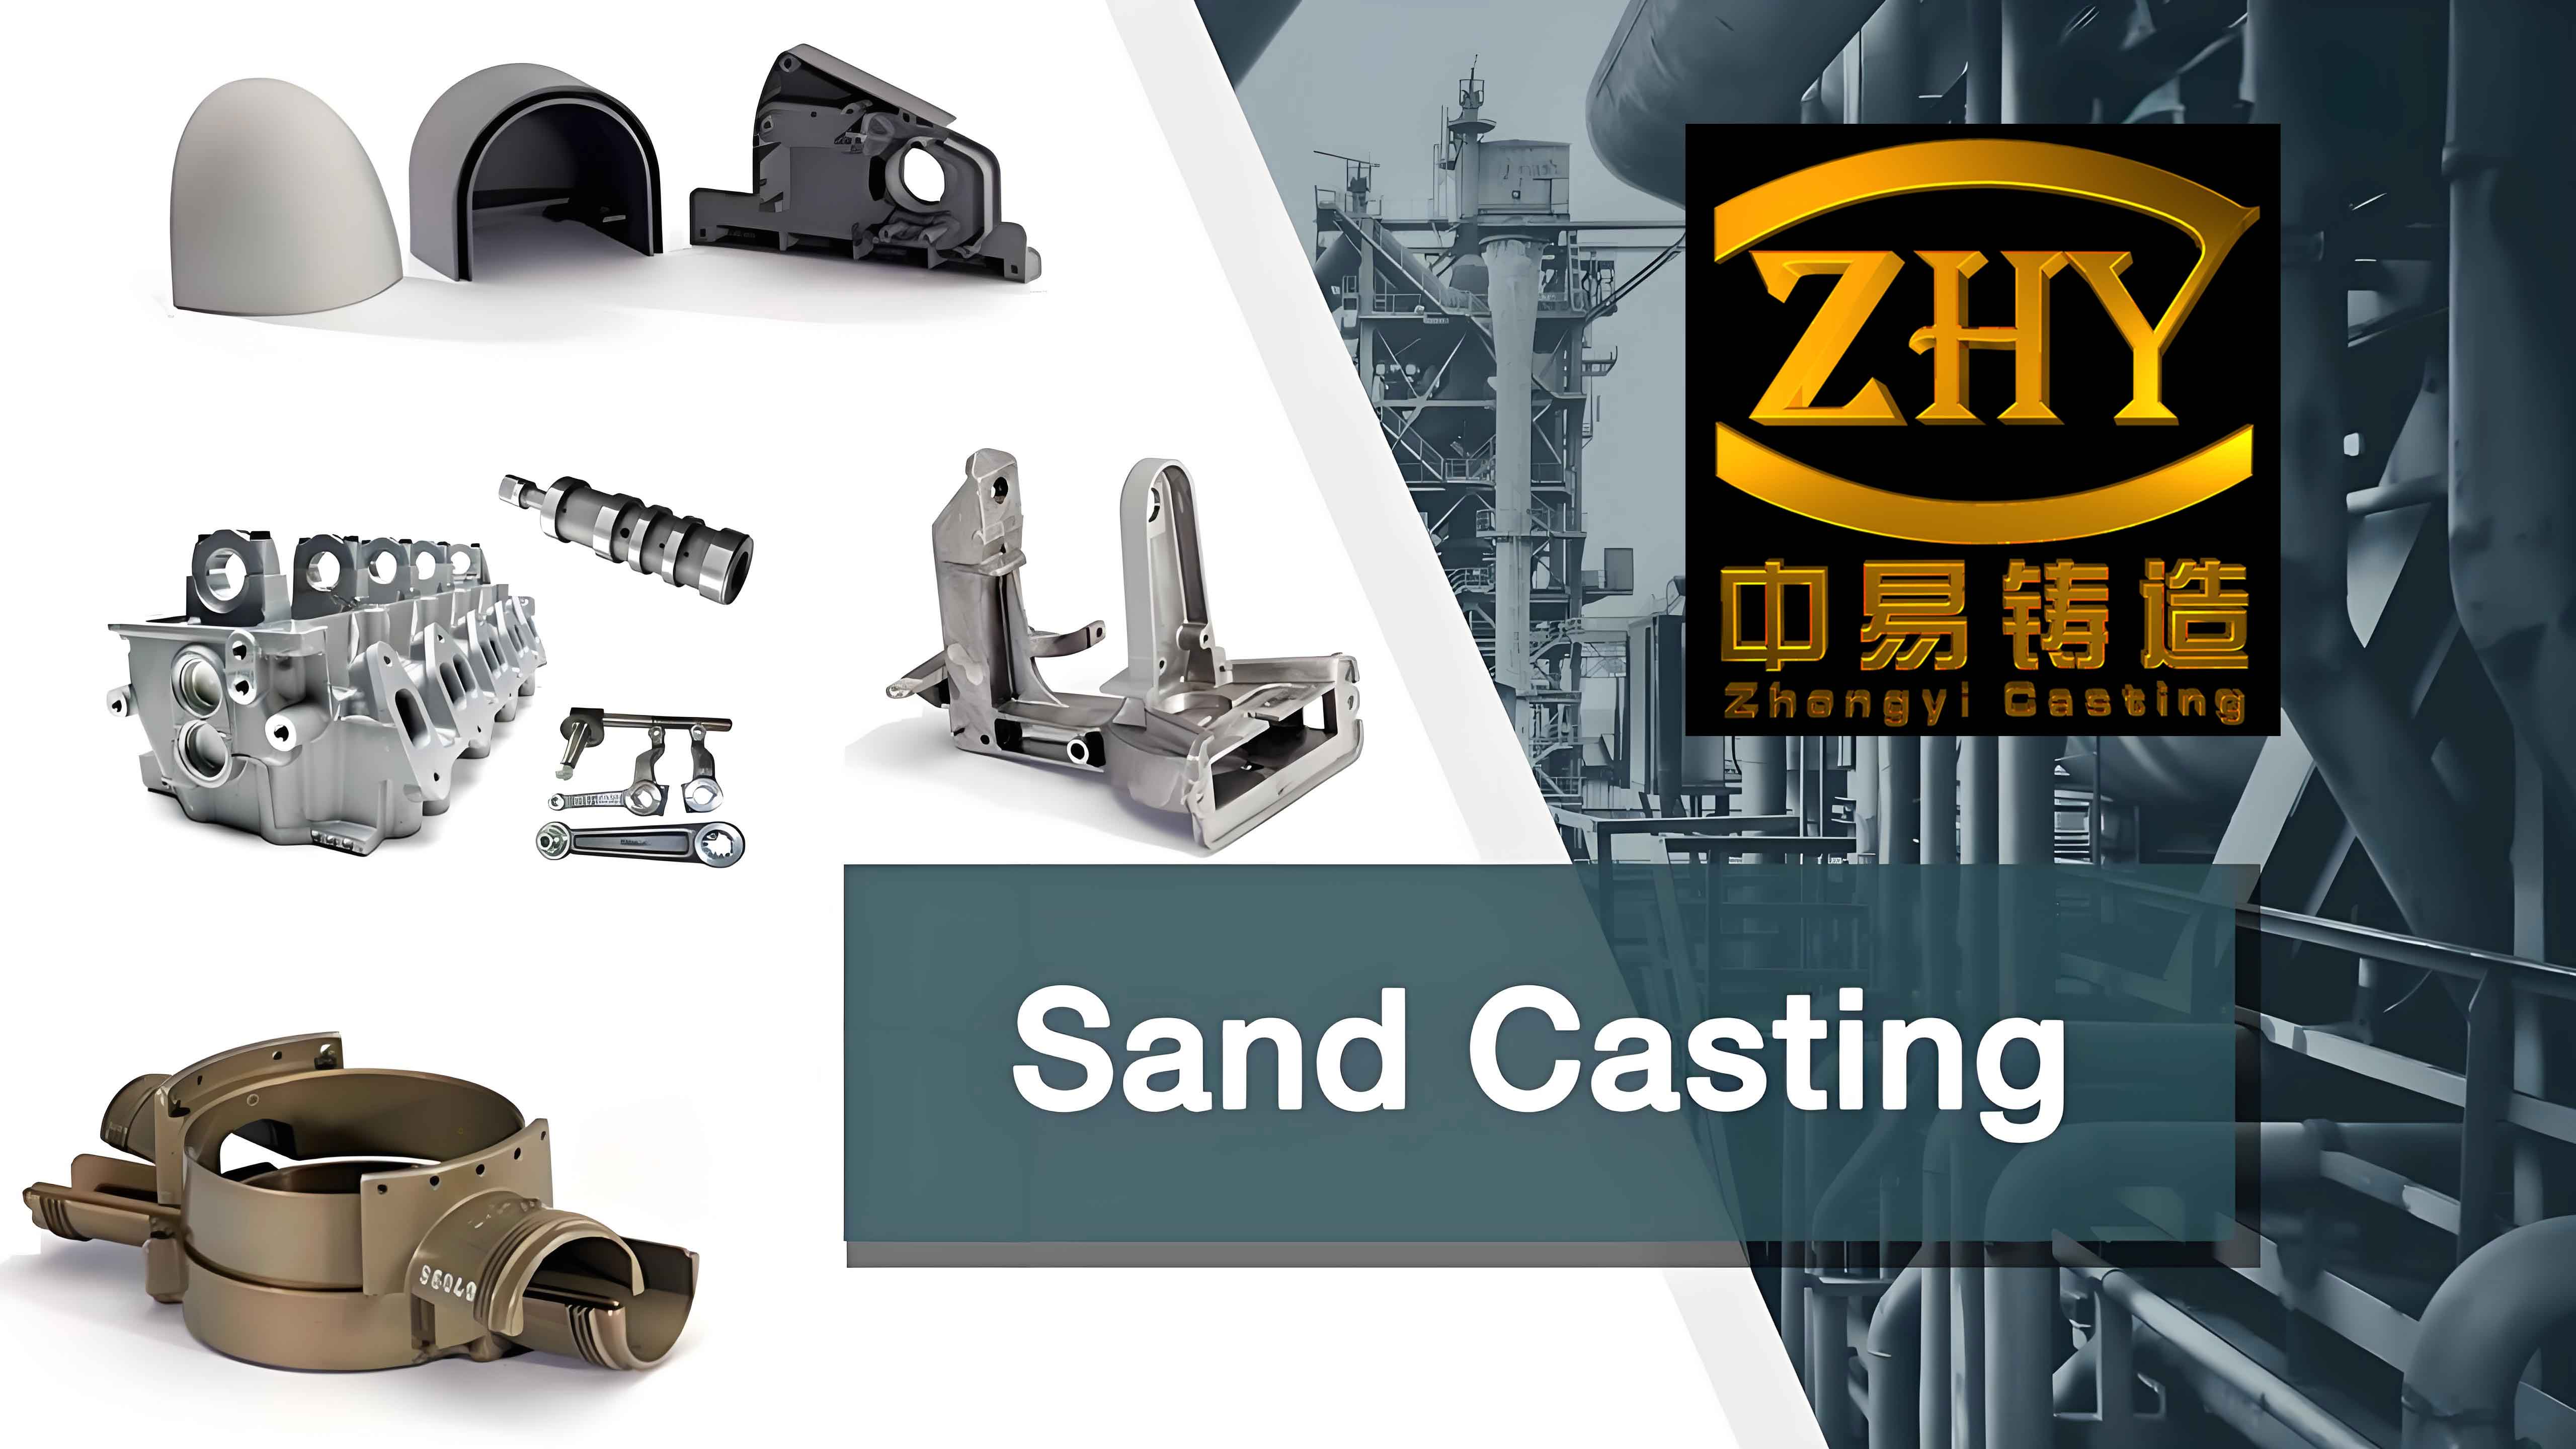
To evaluate the environmental performance of these processes, I classify carbon emissions into three categories: material-related emissions, energy-related emissions, and non-desired output emissions. Material emissions arise from the extraction and processing of sand, binders, metals, and other inputs. Energy emissions are directly tied to the fuel or electricity consumed during production. Non-desired output emissions include the treatment of exhaust gases, slag, dust, and waste sand. The total emission for a given production route can be expressed as:
\[
CE = CE_M + CE_S + CE_P + CE_{PP}
\]
where \(CE_M\) denotes molding stage emissions, \(CE_S\) melting stage emissions, \(CE_P\) pouring stage emissions, and \(CE_{PP}\) post-processing stage emissions.
Influence of Casting Structure and Batch on Emission Modeling
To build a reliable emission prediction model, I collected data from thirty representative casting parts with varying structural attributes. The key parameters considered include casting volume, weight, surface area, minimum thickness, maximum thickness, draft depth, core volume, and number of cores. These parameters fundamentally determine the amount of molding material, core material, and energy required. For example, components with a larger surface area demand more sand and coating, while those with a high number of cores require additional core-making steps. Similarly, the minimum thickness influences the cooling time and the choice of gating system.
Since the range of casting sizes is wide, direct regression on all parts could lead to biased results. Therefore, I first applied the k-means clustering algorithm to group the castings based on their structural characteristics and the corresponding carbon emission values. The clustering process separates the parts into two categories: Class A, which represents smaller and lighter castings, and Class B, which represents larger and heavier ones. The cluster centers for traditional molding emissions were 6205.61 kgCO₂ for Class A and 20804.17 kgCO₂ for Class B when the batch size was set to 50 parts. This separation improves the accuracy of the subsequent ridge regression models.
Ridge regression is particularly useful when predictor variables are correlated, as is often the case with casting dimensions and weight. I developed separate regression equations for each combination of casting class, batch size, and molding process. For instance, for 50 pieces of Class A castings produced with traditional molding, the emission model reduces to:
\[
C_{50}^{TS} = 4.917 + 0.119 V_t + 0.162 M_t + 0.152 S_t + 0.515 N_t
\]
where \(V_t\) is casting volume (in 10² cm³), \(M_t\) is casting weight (in kg), \(S_t\) is surface area (in 10² cm²), and \(N_t\) is the number of cores. The R² value for this model is 0.999, indicating an excellent fit. For Class B castings under the same batch, the model becomes:
\[
C_{50}^{TS} = 6.306 + 0.074 V_t + 0.101 M_t + 0.266 S_t + 2.739 T_{min}
\]
Here \(T_{min}\) is the minimum thickness (in cm). The standardized coefficients reveal that surface area and minimum thickness have the strongest influence on emissions for heavier castings, while volume and weight dominate for smaller ones.
For sand 3D printing molding, the models are simpler because the process does not require patterns and has a more direct relationship with the printed volume. For Class A castings:
\[
C_{50}^{P} = 0.006 + 0.380 V_p + 0.517 M_p
\]
and for Class B castings:
\[
C_{50}^{P} = -9.528 + 0.214 V_p + 0.291 M_p + 0.628 S_p + 9.758 T_{min}
\]
Composite molding, which uses a fraction \(P\) of 3D-printed mold parts and \((1-P)\) of traditional mold parts, yields emission models that scale with \(P\). For Class A castings with a 20% 3D-printed proportion, the model is:
\[
C_{50(20\%)}^{CM} = 2.428 + 0.182 V_p + 0.248 M_p
\]
For a 50% proportion, it is:
\[
C_{50(50\%)}^{CM} = 2.429 + 0.257 V_p + 0.349 M_p
\]
For an 80% proportion, it becomes:
\[
C_{50(80\%)}^{CM} = 2.430 + 0.331 V_p + 0.450 M_p
\]
These models explicitly quantify how increasing the use of 3D printing in the composite mold raises the slope coefficients for volume and weight, reflecting the higher energy intensity of printing.
Batch size has a profound effect on the total emissions. I extended the models to batch sizes of 500 and 1000 pieces, observing that the coefficients change slightly due to economies of scale and the amortization of pattern-related emissions. For example, at a batch of 500 Class A castings using traditional molding, the model becomes:
\[
C_{500}^{TS} = 5.632 + 0.136 V_t + 0.186 M_t + 0.150 S_t + 0.609 N_t
\]
and at 1000 pieces:
\[
C_{1000}^{TS} = 5.707 + 0.133 V_t + 0.181 M_t + 0.157 S_t + 0.571 N_t
\]
The decrease in some coefficient values from 500 to 1000 indicates that the per-part emission for pattern-related activities is lower when production volume is larger. In contrast, the 3D printing process shows a near-linear scaling with volume and weight, with only tiny changes in the intercept as the batch grows.
For melting equipment, I calculated the emissions per ton of molten cast iron based on the reported fuel and electricity consumption. The input parameters are listed in the following table.
| Melting Furnace | Coke Consumption (kg/t) | Electricity Consumption (kWh/t) | Natural Gas Consumption (m³/t) |
|---|---|---|---|
| Coke-fired cupola | 145 | 0 | 0 |
| Induction furnace | 0 | 650 | 0 |
| Natural gas cupola | 0 | 0 | 65 |
| Natural gas rotary furnace | 0 | 0 | 80 |
The carbon emission factors used in this analysis are given below.
| Energy Source | Unit | CO₂ Emission Factor |
|---|---|---|
| Coke | t CO₂/t standard coal | 2.64 |
| Natural gas | t CO₂/t standard coal | 1.63 |
| Electricity | kg CO₂/kWh | 0.785 |
Comparing the melting and pouring stage emissions across the four furnances, it becomes clear that natural gas based systems — especially the natural gas cupola — produce the smallest carbon footprint for any given casting batch. The induction furnace, despite being clean at the point of use, yields the highest emissions when considering the coal-dominated electricity grid in many regions. The coke-fired cupola emits more than natural gas furnaces but less than induction furnaces under the assumed emission factors. These findings underline the importance of selecting a melting furnace that matches the casting weight and production schedule.
Integrated Carbon Emission and Cost Model
I combined the molding process emissions and melting furnace emissions into a total production emission model. The total carbon emission \(CE\) for a given casting batch and melting furnace can be written as:
\[
CE = CE_{B}^{C} + CE_{S}
\]
where \(CE_{B}^{C}\) represents the emissions from the molding and post-processing stages for batch \(B\) using molding method \(C\), and \(CE_{S}\) represents the melting and pouring stage emissions. Because the casting weight is the most significant common factor across all models, the melting emission term can be expressed as:
\[
CE_{S} = e_{m} \cdot M_{total} + e_{fuel} \cdot M_{total}
\]
where \(M_{total}\) is the total weight of cast metal, \(e_{m}\) is the material-related emission factor for the metal charge, and \(e_{fuel}\) is the fuel-related emission factor per unit of metal. In this work, I used the actual melting equipment characteristics and energy emission factors to compute the total emissions.
Cost modeling is equally important for foundries. The total production cost \(C\) is the sum of material cost \(C_M\), labor cost \(C_L\), energy cost \(C_E\), and indirect cost \(C_I\):
\[
C = C_M + C_L + C_E + C_I
\]
Material costs include sand, binders, metals, cores, and consumables. Labor costs reflect the work hours required for molding, pouring, and finishing. Energy costs are determined by the electricity and fuel consumed. Indirect costs encompass equipment depreciation, factory overhead, and environmental compliance costs. By quantifying both emissions and costs, the model provides a comprehensive basis for decision making.
Case Study: Low-Carbon Matching Design for a Furnace Cover Casting
To demonstrate the practical application of the proposed methodology, I analyzed a real furnace cover casting made of gray cast iron HT250. The batch size required is 1000 pieces. The casting geometry parameters are summarized in the following table.
| Parameter | Value |
|---|---|
| Volume | 843.02 cm³ |
| Weight | 6.19 kg |
| Surface area | 3595.17 cm² |
| Minimum wall thickness | 5.12 mm |
| Maximum wall thickness | 35 mm |
| Draft depth | 8.5 cm |
| Number of cores | 0 |
Based on the classification from the k-means clustering, this casting belongs to Class A because its weight is 6.19 kg, which lies in the range of 1 to 10 kg. For Class A castings, the models developed earlier indicate that sand 3D printing molding yields the lowest molding and post-processing emissions when the batch size is 1000. For the melting equipment, the natural gas cupola produces the smallest emissions among the four furnaces for any batch size. Therefore, the recommended low-carbon matching design comprises sand 3D printing molding combined with a natural gas cupola.
I compared this recommended scheme with the conventional production scheme that uses traditional molding and a coke-fired cupola. Using the integrated emission model, the carbon emissions for the low-carbon scheme are calculated as follows.
For the molding and post-processing stages with sand 3D printing:
\[
CE_{1000}^{P} = 0.006 + 0.380 \times 8.43 + 0.517 \times 6.19 = 6.422 \ \text{kg CO}_2
\]
The melting and pouring stage emissions using natural gas cupola per piece are calculated from the fuel consumption and emission factors:
\[
CE_{S} = 0.548 \ \text{kg CO}_2
\]
Adding auxiliary and non-desired emissions gives a total of:
\[
CE_{low} = 6.422 + 11.682 + 0.548 = 19.4 \ \text{kg CO}_2
\]
For the conventional scheme, traditional molding emissions are:
\[
CE_{1000}^{TS} = 5.707 + 0.133 \times 8.43 + 0.181 \times 6.19 + 0.157 \times 35.95 = 13.865 \ \text{kg CO}_2
\]
The melting stage emissions for the coke-fired cupola amount to:
\[
CE_{S} = 0.585 \ \text{kg CO}_2
\]
Thus, the total for the conventional scheme is:
\[
CE_{conv} = 13.865 + 15.675 + 0.585 = 30.6 \ \text{kg CO}_2
\]
The cost comparison is presented in the table below for a single casting.
| Cost Component | Conventional Scheme (CNY) | Low-Carbon Scheme (CNY) |
|---|---|---|
| Material cost | 22.8 | 13.1 |
| Labor cost | 45.8 | 38.7 |
| Energy cost | 7.4 | 6.2 |
| Indirect cost | 28.7 | 13.2 |
| Total cost | 104.7 | 71.2 |
The results show that the low-carbon scheme reduces the total carbon emission from 30.6 kg CO₂ to 19.4 kg CO₂ per casting, which is a 36% reduction. Simultaneously, the total production cost drops from 104.7 CNY to 71.2 CNY, a 32% saving. The major contribution comes from the replacement of traditional molding with sand 3D printing, which eliminates pattern-making and reduces material consumption. Furthermore, substituting the coke-fired cupola with a natural gas cupola lowers the emission intensity in the melting stage by about 23%.
I also analyzed scenarios with different batch sizes (50 and 500 parts) to verify the robustness of the matching design. For a batch of 50 parts, the emission per part is higher due to the lack of economies of scale, but the ranking of the processes and furnaces remains unchanged. For batch sizes larger than 1000, the advantage of traditional molding over 3D printing may become pronounced because the cost per pattern is amortized over many pieces. However, for the specific weight range of 1–10 kg, 3D printing continues to offer lower emissions and costs even at 1000 pieces. These findings indicate that the proposed low-carbon matching design is particularly effective for medium-size batches of small and medium castings.
Conclusion
This research presents a comprehensive method for designing low-carbon sand casting production by explicitly considering the casting structure and batch size. I developed a set of regression-based carbon emission models that capture the influence of major casting parameters on the emissions of three molding processes and four melting equipment types. The integration of these models into a unified carbon emission and cost framework enables foundries to select the most suitable combination of molding method and melting furnace for each production order.
The case study of a furnace cover casting demonstrates that a low-carbon matching design, comprising sand 3D printing molding and a natural gas cupola, can reduce carbon emissions by 36% and total costs by 32% compared with the conventional scheme. These results confirm that significant environmental and economic benefits can be achieved without compromising production quality or delivery requirements.
In future work, I intend to extend the model to accommodate a wider range of casting sizes, including large and very large components, and to incorporate additional parameters such as core complexity, surface finish requirements, and the availability of renewable energy. The ultimate goal is to create a dynamic decision-support system that can optimize the entire sand casting production chain in real time, further contributing to the green transformation of the global foundry industry.