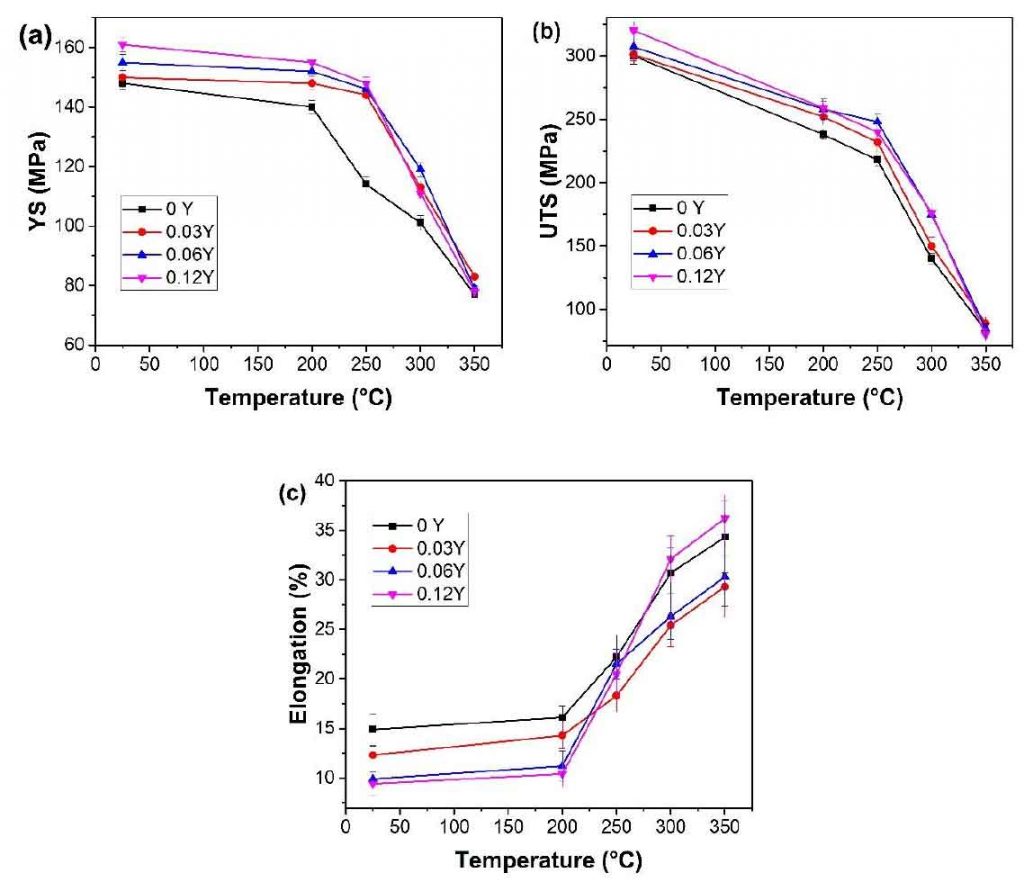
Figure 1 shows the tensile yield strength, tensile strength and elongation of T6 alloy at room temperature and high temperature. It can be seen from Fig. 1A that the yield strength of the alloy decreases with the increase of temperature and increases with the increase of Y content. The results show that the yield strength of Mg – 0.43nd – 0.12y – 0.08zn – 0.11zr alloy is the highest at different temperatures. The addition of 0.12 at.% Y in the alloy significantly increases the yield strength of the alloy, which is mainly due to the grain refinement, solution strengthening and the strengthening effect of β – precipitates. In particular, the yield strength of the alloy with 0.12% Y Content at 200 ℃ and 250 ℃ is 11% and 23% higher than that of the alloy without y element, respectively.

Figure 2B shows the tensile strength at different temperatures. It can be seen from the figure that the tensile strength of the alloy containing y is higher than that of the alloy without y at all different tensile temperatures. The tensile strength of the alloy increases from 300 MPa to 320 MPa when y content increases from 0 to 0.12%. The tensile strength of the alloy with 0.12% Y Content at 200 ℃ and 250 ℃ is 9% and 10% higher than that of the alloy without y element, respectively. Figure 2C shows the elongation of Mg nd XY Zn Zr alloy at different temperatures. The elongation of the alloy increases with the increase of temperature. In addition, when the tensile temperature is less than 200 ℃, the elongation decreases with the increase of Y content. When the temperature is higher than 200 ℃, the elongation of the alloy with 0.06% Y Content and 0.12% y content is higher than that of the alloy with 0.03% y content. When the temperature is higher than 300 ℃, the elongation of the alloy with 0.12% y content is higher than that of the alloy without y element.

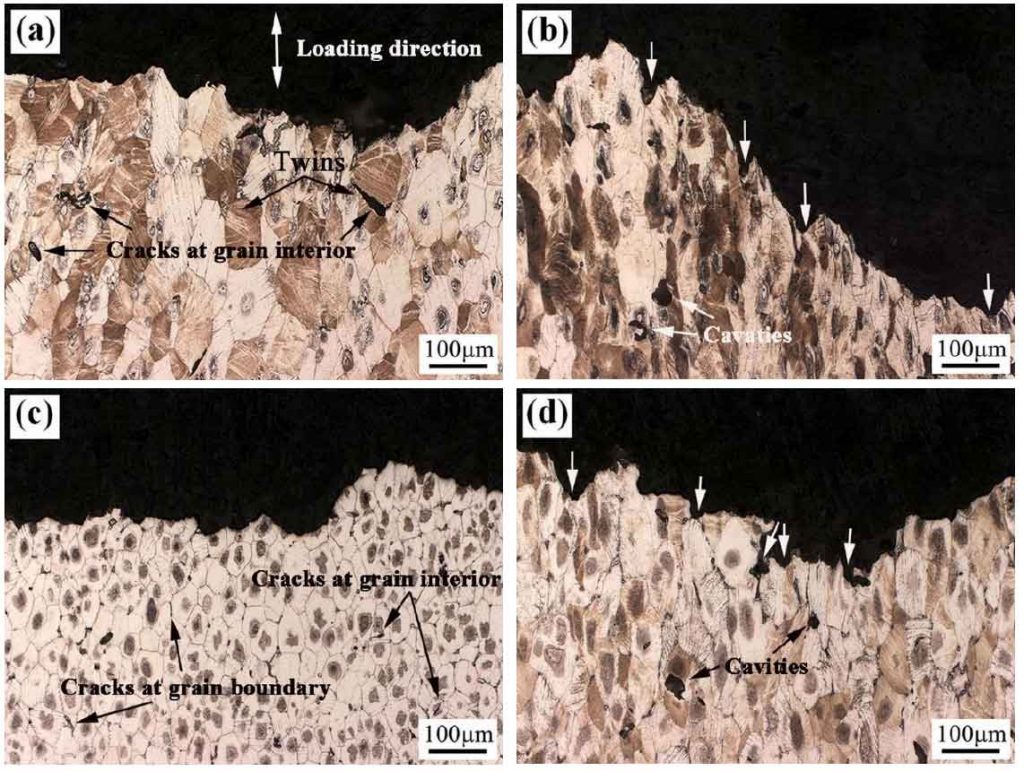
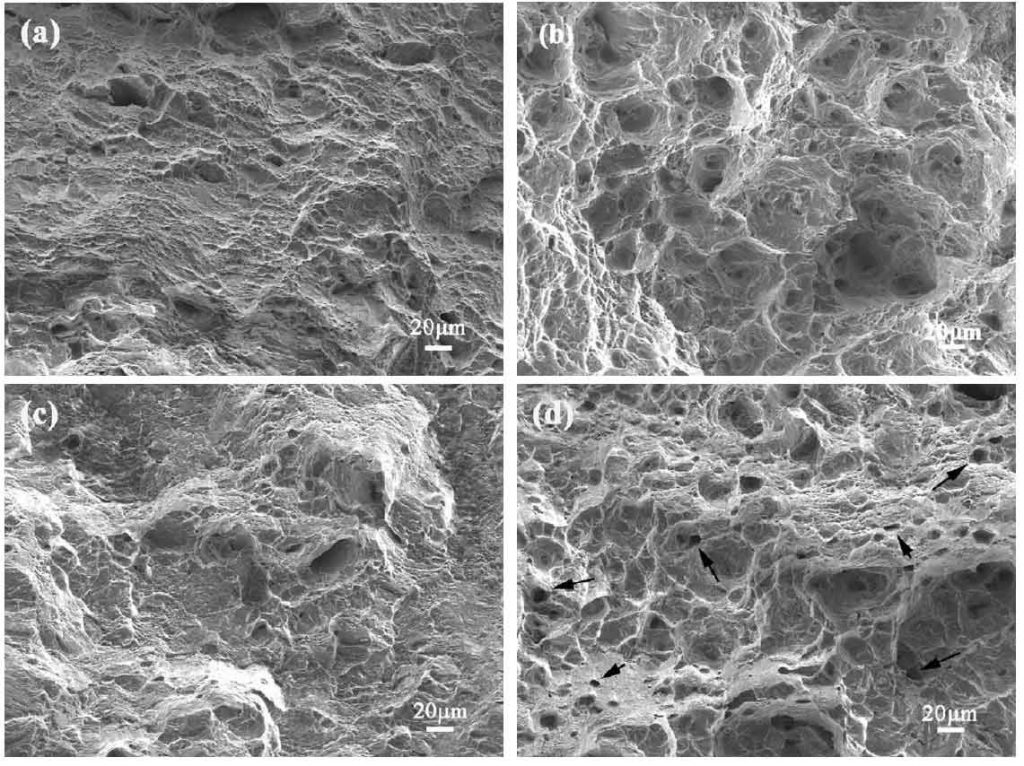
Figure 3 shows the fracture profile of T6 mg – 0.43nd – XY – 0.08zn – 0.11zr alloy after tensile at different temperatures. Figure 4 is the corresponding fracture scanning diagram. When the tensile temperature is 200 ℃, the cracks in mg – 0.43nd – 0.08zn – 0.11zr alloy always propagate along the grain interior (Fig. 3a), and fine dimples can be seen on the tensile fracture surface (FIG. 4A). When the tensile temperature is 250 ℃, the grains elongate in the tensile direction, and large holes can be seen inside the grains, and pits (Fig. 4b) can be seen on the fracture surface corresponding to the grooves (Fig. 3b, arrow). For Mg – 0.43nd – 0.12y – 0.08zn – 0.11zr alloy, the crack propagates along the grain interior or grain boundary at 200 ℃ (Fig. 4C). Under the experimental conditions, the eutectic phase hinders the growth of α – Mg grains (compared with FIG. 3a and C), and some cracks propagate along these brittle eutectic phases, which act as pinning relative to grain boundary slip, so they are closely related to mg – 0.43nd – 0.08zn – 0.11zr Compared with the alloy, the alloy has higher yield strength and tensile strength, lower elongation and less dimples on the fracture surface (Fig. 4C). When the tensile temperature is 250 ℃, the grain size of Mg – 0.43nd – 0.08zn – 0.11zr alloy is smaller than that of Mg – 0.43nd – 0.08zn – 0.11zr alloy (compared with FIG. 3b and D), and more fine pores are formed at the grain boundary (Fig. 3D). On the fracture surface, many small pits corresponding to the grooves of the side section (as shown by the arrow in Fig. 3D) can also be seen (as shown by the arrow in Fig. 4D).
It is easy to form twins in T6 mg nd Zn Alloy under room temperature tension, and the cracks are mainly initiated at grain boundary and twin grain boundary. When tensile temperature is less than 200 ℃, the main deformation mechanism is base slip and twinning. Under the experimental conditions, the cracks of Mg – 0.43nd – 0.08zn – 0.11zr at 200 ℃ mainly propagate along the twins inside the grains (Fig. 3a). However, the addition of Y refines the grain size of the alloy, so in the Y-containing alloy, cracks initiate at grain boundaries or twin boundaries (Fig. 3C). The change of fracture behavior is mainly attributed to the strengthening effect of zn2zr3 phase, β – type precipitate phase and mg12nd phase remaining at the grain boundary.
With the increase of tensile temperature, the cone slip plays a major role and the number of slip systems increases, so the plasticity of Mg – 0.43nd – XY – 0.08zn – 0.11zr alloy increases significantly (Fig. 2D). In addition, when the temperature increases to 250 ℃, the twinning fraction decreases and dynamic recrystallization may occur. Therefore, more holes can be observed in the fracture side section of the alloy (Fig. 3b). This phenomenon can also be observed in the high temperature tensile process of mg-gd-y-zr alloy. In this paper, the addition of Y hinders the growth of α – Mg grains and the formation of voids, so the number of voids in the alloy with 0.12% y content is less than that without y content (compared with FIG. 4B and D). In addition, due to the growth of dispersed precipitates and non base plane slip, the elongation of the alloy with 0.12y content is higher than that of the alloy without y element when the tensile temperature increases to 300 ℃ and 350 ℃.
In addition, the rheological behavior of Mg – 0.43nd – 0.12y – 0.08zn – 0.11zr alloy was investigated in order to further investigate the reason why the mechanical properties of the alloy with y are higher than those of the alloy without y. Arrhenius equation is often used to describe the constitutive behavior of different materials at high temperature
Where 𝜀 is the strain rate, a ′ and N ′ are constants, σ is stress, q is deformation activation energy, R is molar gas constant, t is test temperature. It can be concluded from the above formula that:
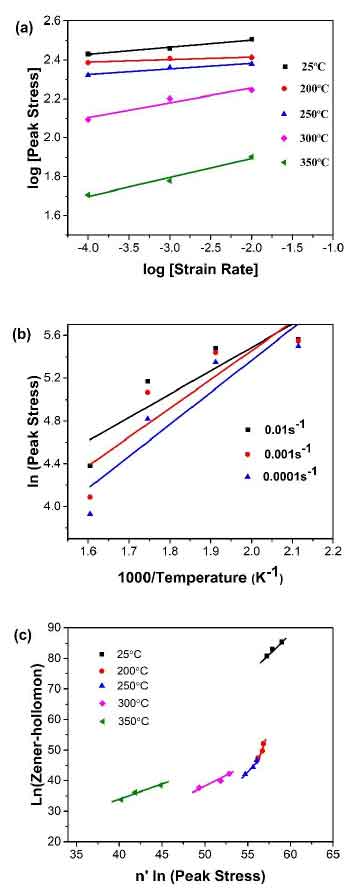
The relationship between peak stress and strain rate is shown in Fig. 5A. With the change of temperature, the slope of the straight line is different, which indicates that the deformation mechanism is also different. The strain index of Mg – 0.43nd – 0.12y – 0.08zn – 0.11zr alloy is about 10.2, which is higher than that of nz30k alloy (8.4). However, the strain exponent of the two alloys is greater than 5, which indicates that dislocation climbing creep is the main deformation mechanism during high temperature tension.
The activation energy can be deduced from the formula

(b) Natural logarithm plot
of peak stress as a function of temperature reciprocal.
(c) Natural logarithm plot of Zener-
Hollomon parameter as a function of peak stress to the power of the stress exponent.
Fig. 5B natural logarithm relationship of temperature reciprocal of peak stress. The Q value of Mg – 0.43nd – 0.12y – 0.08zn – 0.11zr alloy can be calculated from the slope of the linear relationship. The calculated value is 223 kJ / mol, which is larger than the Q value of nz30k alloy (207 kJ / mol). The reason for the high strain index and activation energy is that zn2zr3 and β – precipitates hinder dislocation movement. In addition, the Q value of Mg – 0.43nd – 0.12y – 0.08zn – 0.11zr alloy is higher than that of we54 alloy (217kj / mol) and AZ31 alloy (147kj / mol or 153kj / mol).
In addition, it can be concluded from the formula that:
Where Z is zener Hollomon parameter, which can be expressed by the following formula:
The value of a ‘can be calculated from the slope of the linear fitting curve in Fig. 5C. Based on the above calculation results, the following model can be established to quantitatively describe the effects of deformation temperature and strain rate on the flow stress of Mg – 0.43nd – 0.12y – 0.08zn – 0.11zr alloy
In conclusion, the following conclusions can be drawn: due to the strengthening effect of zn2zr3 phase and β – type precipitates, the addition of trace y element in mg nd Zn Zr alloy can effectively improve the high temperature mechanical properties of the alloy.


