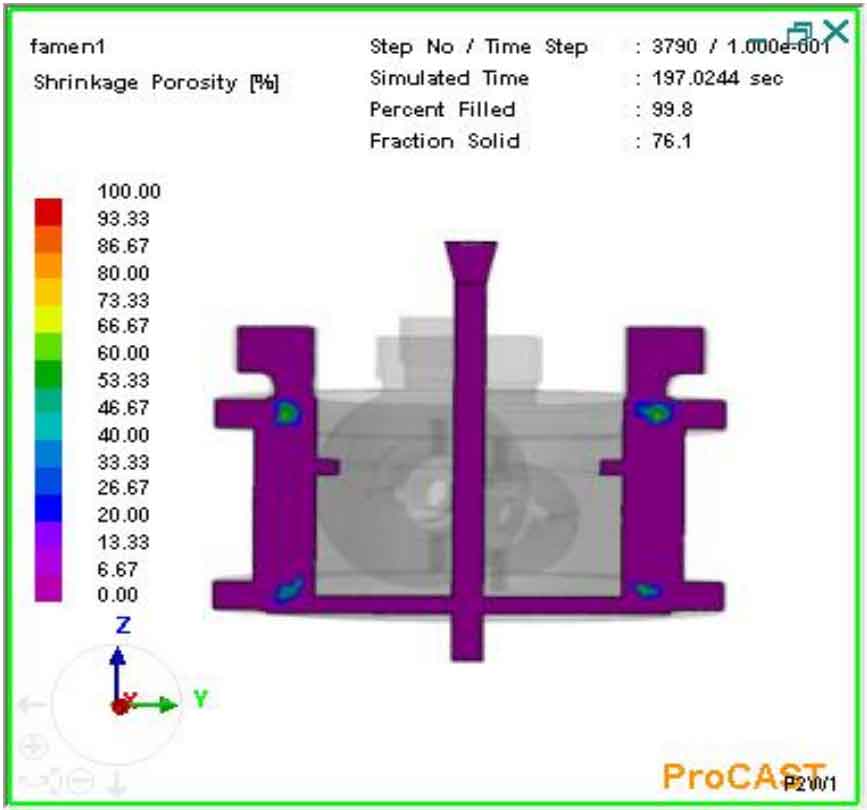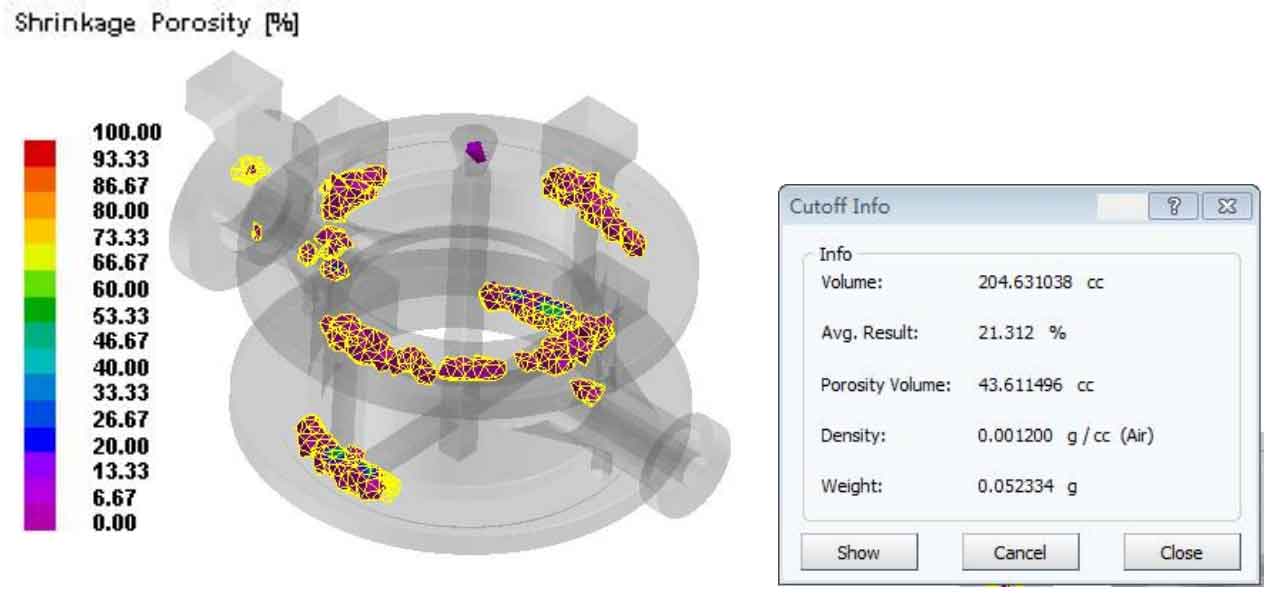
Figure 1 shows the distribution of shrinkage cavity and porosity predicted by numerical simulation technology under the original process scheme. Fig. 2 is the shrinkage cavity distribution diagram obtained by the direct analysis method. We can see that there are obvious shrinkage cavity and shrinkage porosity defects at the hot joint, large rotating part and riser root of the casting, which is basically consistent with the reflection of the solid rate distribution diagram in Fig. 3.
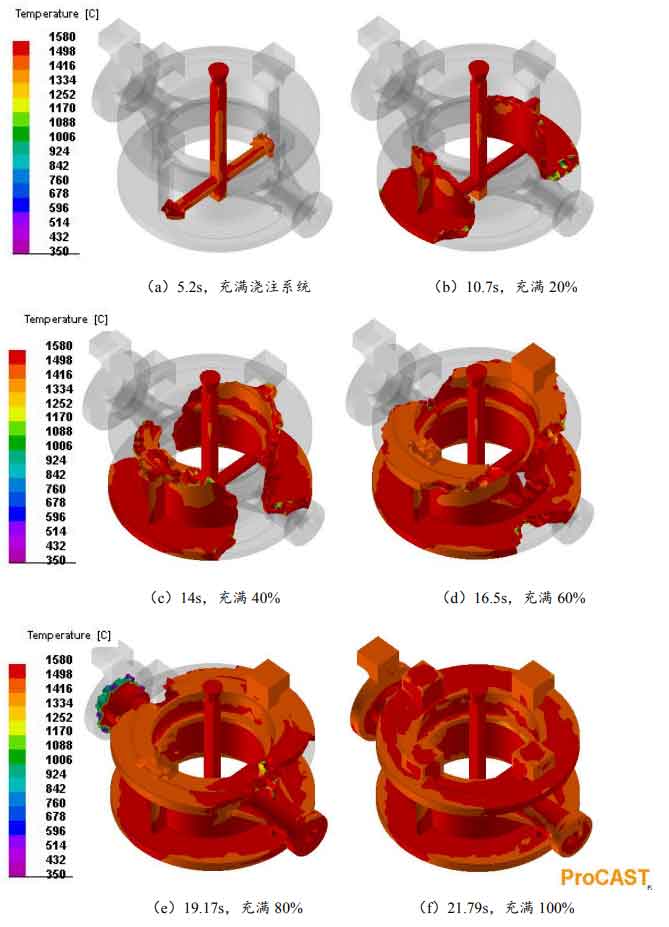
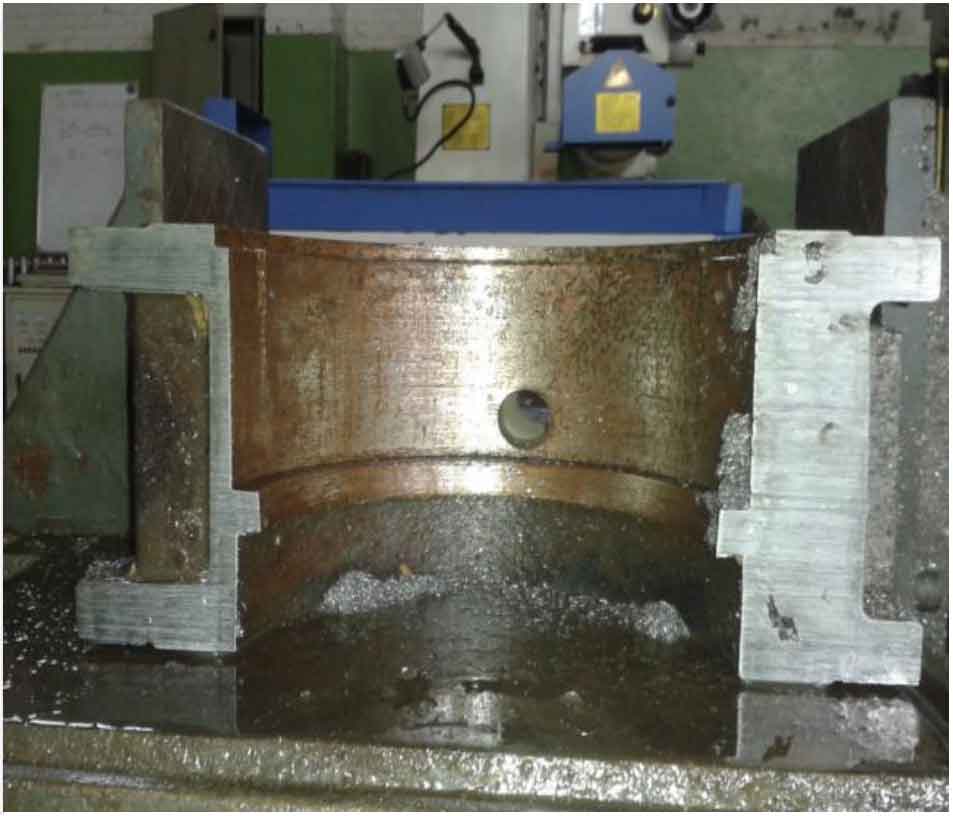
Figure 4 shows the cross-sectional defect diagram of the actual production casting. Compared with figure 2, the defect location is basically the same, which verifies that the application of ProCAST numerical simulation in lost foam casting process has a high degree of fit with the actual production. According to the visual viewer interface of ProCAST, the shrinkage porosity of the casting is 43.611496cc, and the shrinkage porosity is 21.312%.