
The manufacturing of high-integrity sand casting parts, particularly for demanding applications such as automotive powertrains, presents a significant challenge in defect control. Among these defects, shrinkage porosity remains a primary concern, directly impacting the pressure tightness, mechanical properties, and overall reliability of the final component. This is especially critical for complex geometries like cylinder heads, where varying section thicknesses create inherent thermal gradients and isolated hot spots during solidification. Traditional trial-and-error methods for process optimization are costly and time-consuming. Consequently, numerical simulation has become an indispensable tool for virtually prototyping the casting process, predicting defect formation, and guiding the selection of optimal process parameters before physical production begins.
This article investigates the influence of two pivotal process parameters—pouring temperature and initial mold temperature—on the formation of shrinkage defects in a cylinder head produced via sand casting. Utilizing a dedicated casting simulation system, a comprehensive numerical study was conducted. The core objective is to quantify the sensitivity of shrinkage defect population to these parameters and identify a favorable process window for minimizing such defects, thereby contributing to the enhanced quality and yield of sand casting parts.
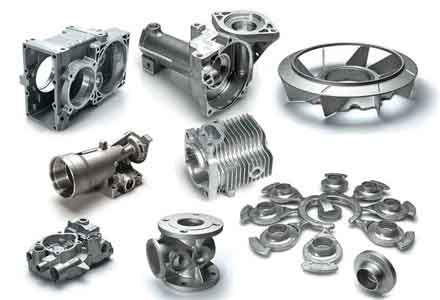
The fundamental challenge in producing sound sand casting parts lies in managing the volume contraction associated with the phase change from liquid to solid. When this contraction is not adequately compensated by feed metal from risers or adjacent sections, voids—shrinkage porosity—form. The severity and location of these defects are governed by the solidification sequence, which is intrinsically linked to the thermal history of the casting. Pouring temperature (Tpour) and mold temperature (Tmold) are two primary levers controlling this thermal history. A higher Tpour increases the total superheat that must be dissipated, potentially delaying the onset of directional solidification and enlarging the mushy zone. Conversely, a higher Tmold reduces the initial thermal gradient between the metal and the mold, slowing down the cooling rate. Both effects can alter the temperature gradient and the local solidification time at critical hot spots, thereby influencing the nucleation and growth of shrinkage cavities. The interaction between these parameters is complex and non-linear, necessitating a systematic analysis.
The mathematical foundation for simulating this process is rooted in solving the transient heat conduction equation, accounting for the release of latent heat during phase change. The governing energy equation for the casting-mold system can be expressed as:
$$
\rho c_p \frac{\partial T}{\partial t} = \nabla \cdot (k \nabla T) + \dot{Q}_{latent}
$$
where $\rho$ is density, $c_p$ is specific heat, $k$ is thermal conductivity, $T$ is temperature, $t$ is time, and $\dot{Q}_{latent}$ is the latent heat source term. For the sand casting parts under study, the latent heat release is a function of the solid fraction ($f_s$), which is itself temperature-dependent for the alloy used. Advanced simulation systems implement a micro-macro coupling approach to predict shrinkage formation. Macro-scale simulations solve the above energy equation to determine temperature fields and solidification patterns. At the micro-scale, models based on mass conservation and pressure drop in the mushy zone are employed to identify regions where internal pressure falls below a critical threshold for pore nucleation. A commonly used criterion involves calculating the pressure gradient and the feeding flow resistance. The Niyama criterion, often adapted in modified forms within software, is a classic example that relates local thermal parameters to the likelihood of shrinkage porosity:
$$
Ny = \frac{G}{\sqrt{\dot{T}}}
$$
where $G$ is the temperature gradient and $\dot{T}$ is the cooling rate at the solidus front. Regions with a Niyama value below a critical threshold are flagged as potential shrinkage sites. Modern systems like the one used in this study extend this to a direct volume-based method for quantitative shrinkage prediction.
Numerical Methodology and Simulation Setup
The study focused on a compacted graphite iron (CGI) cylinder head, a quintessential example of a high-value, complex sand casting part. The 3D CAD model of the casting, along with its gating and risering system, was imported into the simulation environment. The process employed a horizontal molding and vertical pouring configuration with a bottom-gating top-riser system designed to promote progressive solidification from the bottom upwards.
A critical step in numerical simulation is spatial discretization. The entire domain (casting, cores, molds, risers) was meshed into finite-difference cells. A uniform mesh scheme was chosen to balance accuracy and computational efficiency. The details of the meshing protocol are summarized below:
| Mesh Type | Total Cell Count | Casting Cell Count | Cell Edge Length (mm) | Pouring Weight (kg) | Cast Weight (kg) | Yield (%) |
|---|---|---|---|---|---|---|
| Uniform | 13,296,465 | 960,627 | 3.5 | 408 | 283 | 69.33 |
The material properties for the CGI alloy (e.g., Ru450) and the bonded sand mold were assigned from the software’s integrated database. Key boundary conditions included the interfacial heat transfer coefficients between metal-sand and sand-environment. The gravity feeding effect was activated to simulate the liquid metal feeding through the risers during solidification.
The experimental design was a two-factor parametric study. Based on typical industrial ranges, the following parameter windows were selected for investigation. The goal was to understand the individual and combined effects on the predicted shrinkage pore count within the finished sand casting parts.
| Process Parameter | Symbol | Range |
|---|---|---|
| Pouring Temperature | Tpour | 1360 °C to 1400 °C |
| Initial Mold Temperature | Tmold | 20 °C to 40 °C |
A full factorial simulation matrix was constructed, resulting in 15 distinct simulation cases, as detailed in Table 2. This design allows for a clear analysis of the main effects of each parameter and their potential interactions.
| Simulation ID | Pouring Temperature, Tpour (°C) | Mold Temperature, Tmold (°C) |
|---|---|---|
| 1 | 1360 | 20 |
| 2 | 1370 | 20 |
| 3 | 1380 | 20 |
| 4 | 1390 | 20 |
| 5 | 1400 | 20 |
| 6 | 1360 | 30 |
| 7 | 1370 | 30 |
| 8 | 1380 | 30 |
| 9 | 1390 | 30 |
| 10 | 1400 | 30 |
| 11 | 1360 | 40 |
| 12 | 1370 | 40 |
| 13 | 1380 | 40 |
| 14 | 1390 | 40 |
| 15 | 1400 | 40 |
Analysis of Simulation Results and Defect Sensitivity
The solidification sequence for all cases confirmed the intended directional progression from the bottom of the cylinder head towards the top risers. However, the precise thermal profile within thick-walled sections (e.g., around valve guides and combustion chamber areas) varied significantly with the input parameters. These thick sections acted as persistent hot spots, solidifying last and becoming the primary sites for shrinkage cavity formation, as predicted by the software’s feeding and porosity modules.
The quantitative output of primary interest was the total count of discrete shrinkage porosity volumes predicted within the casting envelope, excluding the risers. The results for all 15 simulations are compiled in Table 3. This data forms the basis for the subsequent sensitivity analysis.
| Tmold (°C) | Shrinkage Pore Count at Tpour (°C) | ||||
|---|---|---|---|---|---|
| 1360 | 1370 | 1380 | 1390 | 1400 | |
| 20 | 30 | 22 | 32 | 35 | 38 |
| 30 | 24 | 26 | 29 | 31 | 34 |
| 40 | 22 | 25 | 28 | 30 | 33 |
The data reveals distinct trends. At a constant mold temperature of 20°C, the pore count first decreases to a minimum of 22 at Tpour = 1370°C, then increases monotonically with further increases in pouring temperature. This suggests an optimal point exists at this specific mold condition. In contrast, for mold temperatures of 30°C and 40°C, the relationship is simpler: the pore count steadily increases as the pouring temperature rises, with the minimum count occurring at the lowest tested pouring temperature of 1360°C (24 and 22 pores, respectively).
Examining the effect of mold temperature at constant pouring levels provides another perspective. For lower pouring temperatures (1360°C), increasing the mold temperature from 20°C to 40°C actually reduced the pore count. However, for higher pouring temperatures (1370°C and above), the pore count showed minimal variation with changing mold temperature, indicating a state of relative insensitivity within this range for these sand casting parts.
To move beyond visual trend inspection and objectively quantify parameter sensitivity, a statistical correlation analysis was performed. The Pearson correlation coefficient (r) was calculated between the pore count (Y) and each process parameter (X). The coefficient is defined as:
$$
r_{XY} = \frac{\text{Cov}(X, Y)}{\sigma_X \sigma_Y}
$$
where $\text{Cov}(X, Y)$ is the covariance of X and Y, and $\sigma_X$, $\sigma_Y$ are their standard deviations. The value of $r$ ranges from -1 (perfect negative correlation) to +1 (perfect positive correlation), with 0 indicating no linear correlation. The calculated coefficients for different conditional sets are presented in Table 4.
| Condition | Correlated Variables | Coefficient (r) | Interpretation |
|---|---|---|---|
| Tmold = 20°C | Pore Count vs. Tpour | r1 = +0.725 | Strong Positive Correlation |
| Tmold = 30°C | Pore Count vs. Tpour | r2 = +0.920 | Very Strong Positive Correlation |
| Tmold = 40°C | Pore Count vs. Tpour | r3 = +0.911 | Very Strong Positive Correlation |
| Tpour = 1360°C | Pore Count vs. Tmold | r4 = -0.993 | Near-Perfect Negative Correlation |
| Tpour = 1370°C | Pore Count vs. Tmold | r ≈ 0* | No Correlation (Zero Variance) |
| Tpour = 1380°C | Pore Count vs. Tmold | r ≈ 0* | No Correlation (Zero Variance) |
| Tpour = 1390°C | Pore Count vs. Tmold | r5 = 0.000 | No Correlation |
| Tpour = 1400°C | Pore Count vs. Tmold | r6 = -0.866 | Strong Negative Correlation |
* Pore count showed negligible change across mold temperatures, leading to near-zero variance and correlation.
The analysis yields a clear and significant conclusion: Pouring temperature exhibits a more dominant and consistent influence on shrinkage formation in these sand casting parts compared to mold temperature. This is evidenced by the consistently high positive correlation coefficients (r2, r3 > 0.9) when mold temperature is held constant. The relationship is strongly linear—higher pouring temperature directly leads to more shrinkage pores for mold temperatures of 30°C and 40°C. The effect at 20°C is also positive but slightly less linear, likely due to the presence of the optimum at 1370°C.
The influence of mold temperature is more conditional. It shows a strong negative correlation only at the extreme low pouring temperature (1360°C), meaning a warmer mold helps at this specific low-heat-input condition. At intermediate and high pouring temperatures, its effect diminishes or becomes negligible. This can be physically interpreted: when the superheat from a high pouring temperature is already large, the additional thermal energy from a slightly preheated mold (20°C to 40°C) has a marginal further impact on the solidification dynamics of the hot spots. However, at a low pouring temperature near the liquidus, the initial mold temperature plays a more critical role in establishing the early thermal gradient and feeding characteristics.
The underlying metallurgical principles explain the primacy of pouring temperature. A higher Tpour increases the total latent heat and superheat that must be extracted. This prolongs the solidification time of the entire casting, but disproportionately affects thick sections. The extended local solidification time ($t_f$) in hot spots, which can be conceptually related to the Chvorinov rule, allows for a longer period of pore nucleation and growth under insufficient feeding pressure. The relationship can be conceptually framed as:
$$
\text{Pore Severity} \propto f(t_f, \Delta P) \quad \text{and} \quad t_f \propto \left( \frac{V}{A} \right)^n \cdot \Phi(T_{pour}, T_{mold})
$$
where $V/A$ is the modulus of the section, $\Delta P$ is the feeding pressure drop, and $\Phi$ is a function heavily weighted by pouring temperature. The simulation inherently accounts for these complex interdependencies, with the results quantitatively confirming that controlling pouring temperature is the more powerful lever for defect reduction in the production of such sand casting parts.
Discussion and Practical Implications for Sand Casting
The findings from this numerical study have direct implications for foundry practice, especially in high-volume production environments for precision sand casting parts like cylinder heads. The identification of pouring temperature as the key sensitive parameter provides a clear focus for process control strategies.
First, the results argue for implementing tighter statistical process control (SPC) on pouring temperature compared to mold temperature. While controlling both is ideal, resources dedicated to minimizing variance in pouring temperature will likely yield a greater return on investment in terms of reducing shrinkage-related scrap. The simulation suggests that for the studied geometry and alloy, a lower pouring temperature (e.g., 1360-1370°C) is generally beneficial, provided it remains above the fluidity limit to ensure complete mold filling.
Second, the identified “optimal” conditions (e.g., Tpour=1370°C & Tmold=20°C; Tpour=1360°C & Tmold=30/40°C) represent promising starting points for physical trials. It is crucial to note that these are simulation-derived optima for shrinkage only. A holistic process window must also consider other factors like filling-related defects (misruns, cold shuts), surface quality, and microstructure, which may impose different constraints. For instance, a very low pouring temperature might increase the risk of mist runs in thin sections of complex sand casting parts.
Third, the minimal sensitivity to mold temperature at higher pouring levels can be viewed as an operational advantage. In a production setting, maintaining a perfectly constant initial mold temperature can be challenging due to environmental factors and cycle time variations. The insensitivity within the 20-40°C range, when coupled with a properly controlled pouring temperature, offers a degree of robustness to this natural process variation, enhancing the consistency of the final sand casting parts.
This study also underscores the value of numerical simulation as a pre-emptive quality engineering tool. By virtually exploring a wide parameter space, it reduces the number of costly physical prototypes and shortens the development cycle for new castings. The ability to quantitatively compare “what-if” scenarios allows engineers to make data-driven decisions, moving beyond empirical rules of thumb. Future work could expand this analysis to include other critical parameters such as riser size, chilling effects, and alloy composition variations, further refining the process window for defect-free production of high-performance sand casting parts.
Conclusion
Through a systematic numerical investigation using casting simulation software, this study has elucidated the relative impact of pouring temperature and initial mold temperature on shrinkage porosity formation in a complex cylinder head produced via sand casting. The key findings are:
- Shrinkage defects are predominantly predicted in the thick-walled sections of the casting, which solidify last and present significant feeding challenges.
- The relationship between process parameters and defect count is quantifiable. Optimal combinations for minimizing pore count were identified, such as a pouring temperature of 1370°C with a 20°C mold, and 1360°C with 30°C or 40°C molds.
- A significant insensitivity of shrinkage count to mold temperature variations (20-40°C) was observed when the pouring temperature was at or above 1370°C.
- Statistical correlation analysis conclusively demonstrated that pouring temperature has a more pronounced and consistent linear influence on the number of shrinkage defects compared to mold temperature within the studied ranges. This establishes pouring temperature as the primary control parameter for managing this specific defect in such sand casting parts.
This research exemplifies a modern, simulation-driven approach to optimizing foundry processes. By pinpointing critical control factors and their effects, it provides a scientific basis for improving quality, yield, and reliability in the manufacturing of demanding sand casting parts, ultimately contributing to more efficient and sustainable production practices.