
In the field of mechanical engineering, bearing seats play a crucial role as structural components that support bearings, ensuring precise rotation, reducing friction, and enhancing the lifespan and reliability of equipment. As a key transmission auxiliary part, the bearing seat typically positions at both ends of a bearing to provide fixed support, thereby maintaining positional relationships with other connected components. The accuracy of the bearing seat, particularly in its inner bore and base sections, directly influences the precision of the transmission process. The inner bore serves as a cooperative surface with the bearing, offering support and positioning, while the base acts as a critical machining and load-bearing face. Any inadequacy in base quality or improper installation can lead to failure under external forces. Therefore, producing high-quality bearing seats through efficient casting processes is paramount.
Traditional casting process design often relies on the trial-and-error method, which is time-consuming, resource-intensive, and may not yield optimal results. With advancements in computational technology, numerical simulation has emerged as a powerful tool to complement and enhance traditional approaches. By leveraging software like ProCAST, designers can visualize the filling and solidification processes, predict potential defects, and optimize parameters before physical production. This not only saves time and costs but also improves casting quality significantly. This article delves into the application of numerical simulation to optimize the gray iron casting process for an upper bearing seat component, focusing on process design, analysis, and iterative improvements.
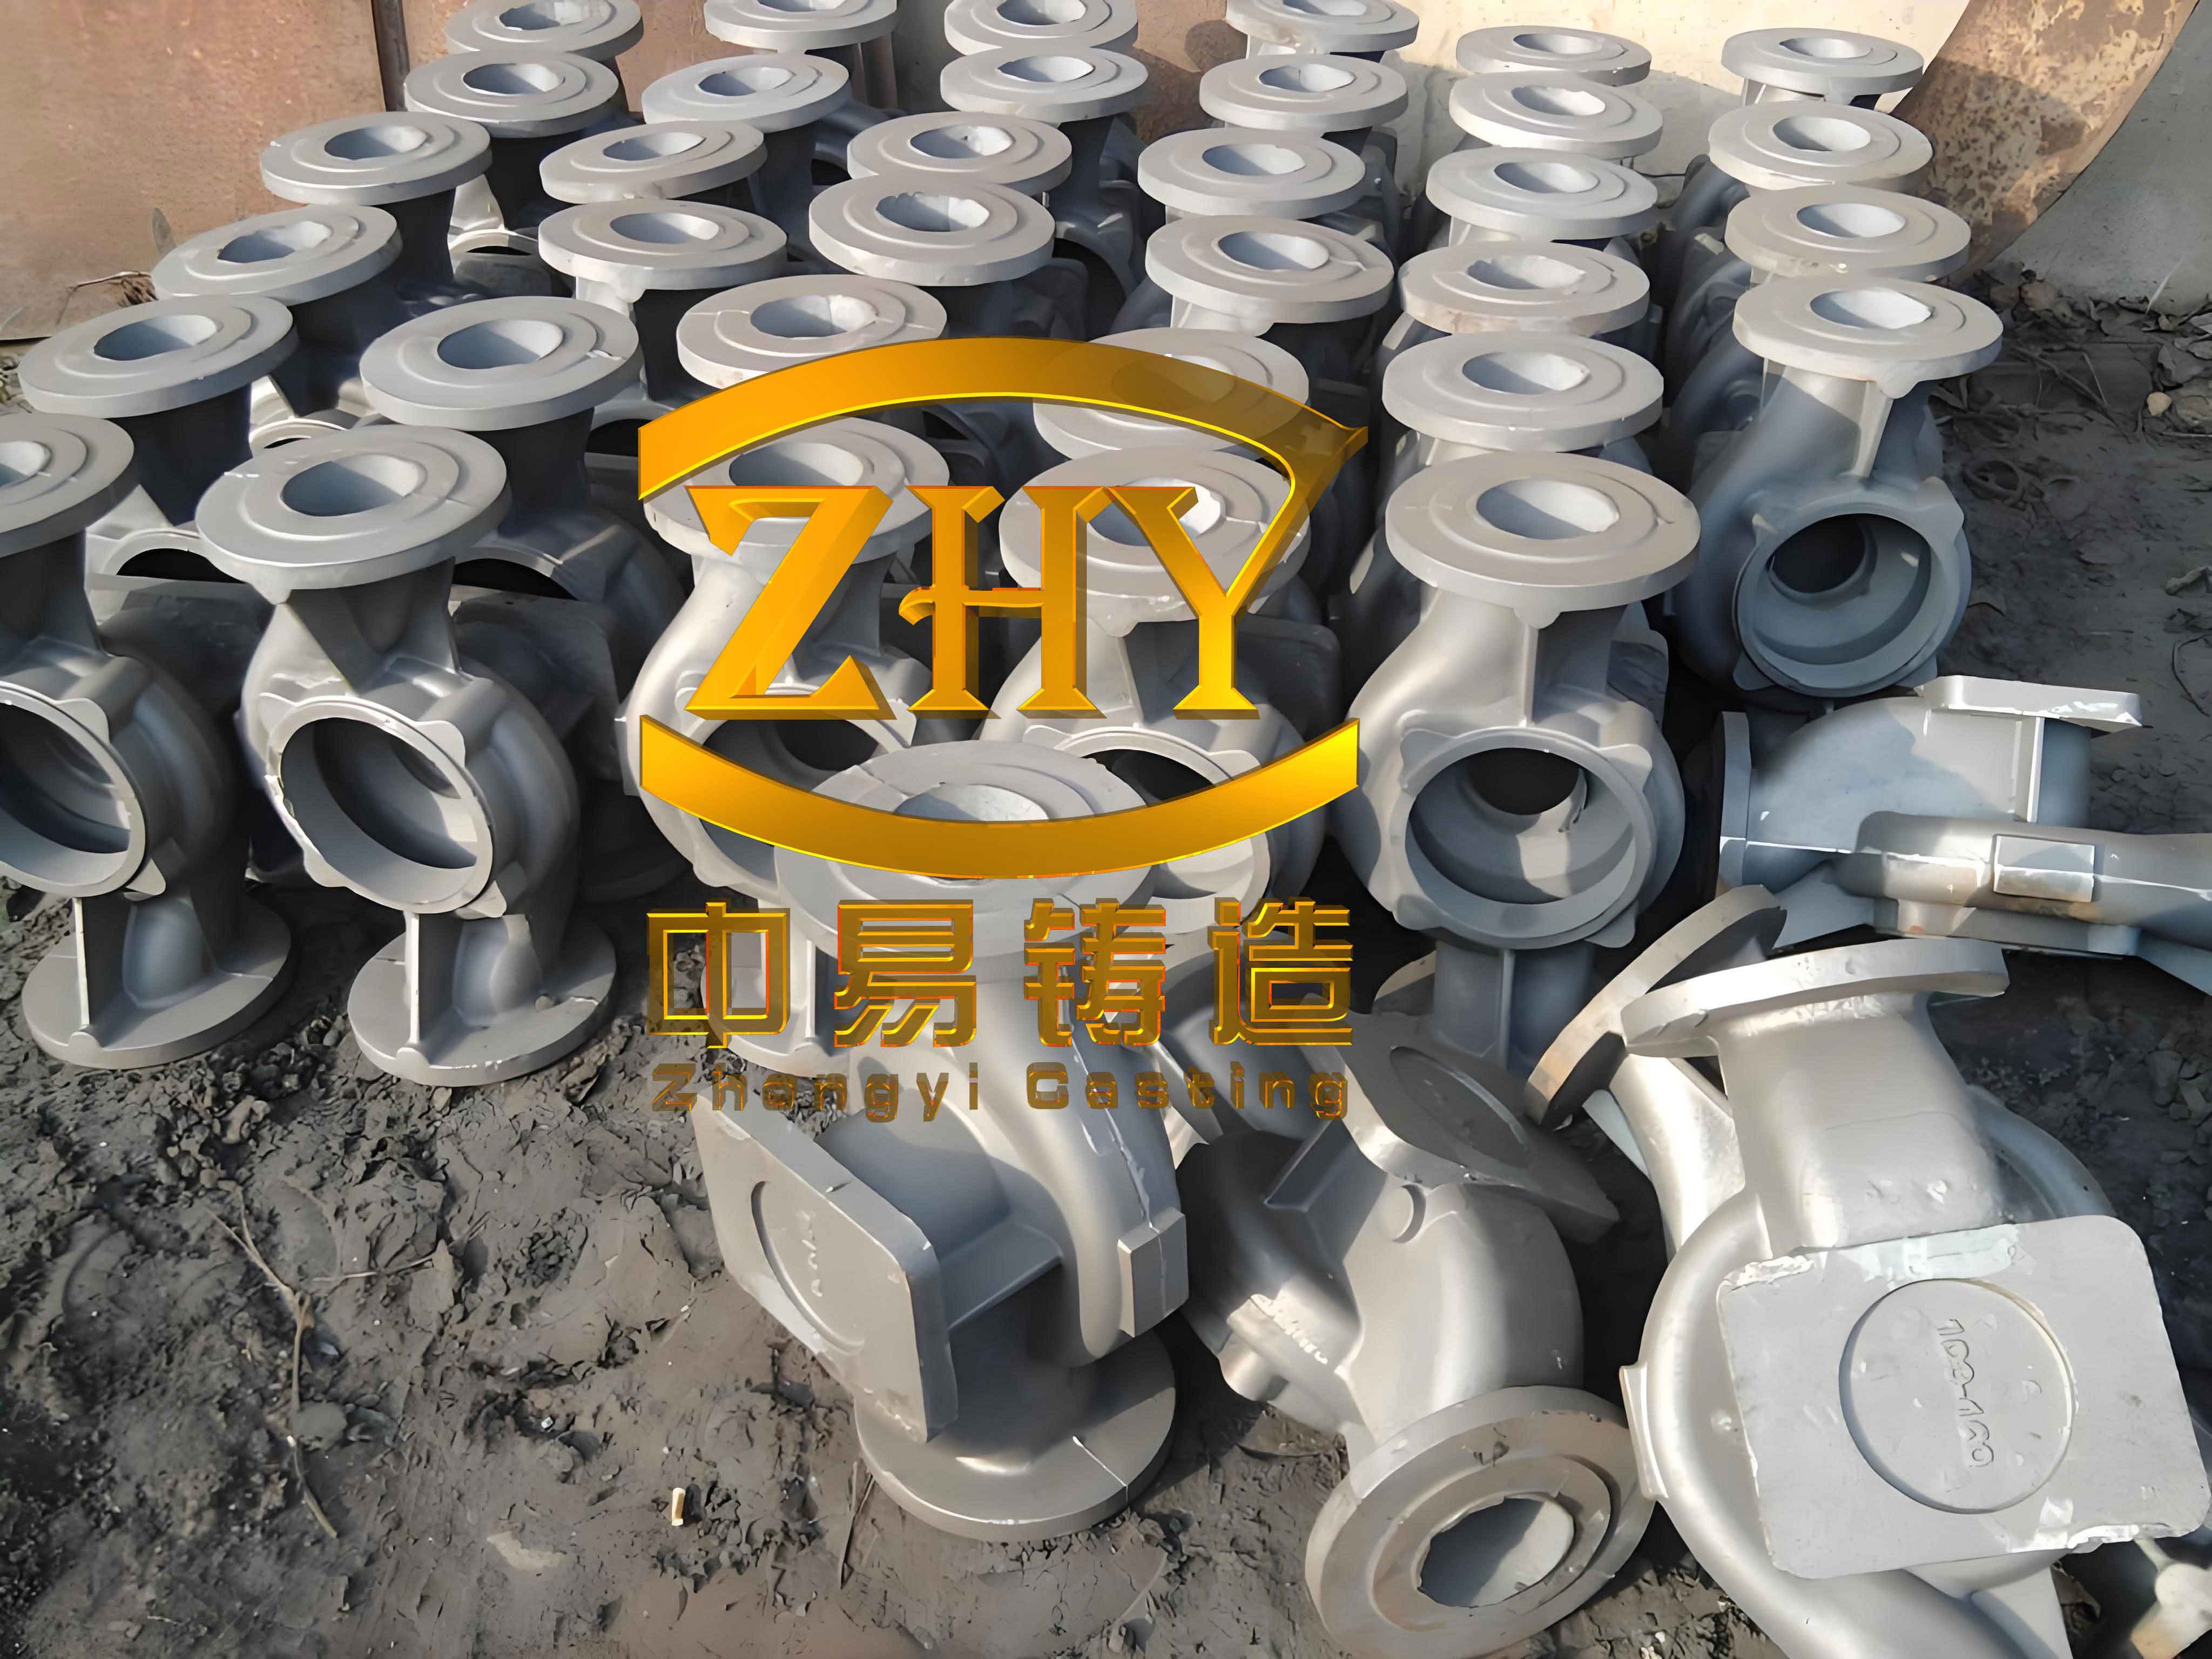
The upper bearing seat, as analyzed here, is fabricated from HT250, a grade of gray iron known for its good strength, wear resistance, thermal stability, and damping capacity. Gray iron casting involves a solidification process that includes the precipitation of primary phases, eutectic transformation, and the solidification of residual liquid metal. The flake graphite morphology in gray iron contributes to volume expansion during solidification, which can compensate for liquid shrinkage, thereby reducing the need for extensive feeding. However, challenges arise due to uneven wall thicknesses in complex geometries, leading to hot spots and defects like shrinkage porosity and cavities. Thus, a meticulous process design is essential for successful gray iron casting.
Casting Part Analysis and Material Considerations
The upper bearing seat has an overall envelope dimension of 1085 mm × 910 mm × 380 mm, with a maximum wall thickness of 145 mm, a minimum of 20 mm, and an average of approximately 25 mm. The structure is relatively symmetrical but features significant variations in wall thickness, creating potential thermal junctions where cooling rates differ. The part weight is 566 kg, classifying it as a medium-sized casting suitable for small-batch production. For this gray iron casting, sand casting with manual molding was selected due to its flexibility, cost-effectiveness, and maturity in handling such components. The molding material employed was acid-cured furan resin self-hardening sand, known for its thermal stability and suitability for small-scale iron casting production. A resin sand coating, composed of refractory aggregates, water-soluble aldehyde resin, and methanol, was applied to isolate the molten iron from the sand mold.
HT250, the material of choice, primarily consists of pearlite with flake graphite. Its properties make it ideal for parts requiring durability under stress. The chemical composition typically includes elements like carbon, silicon, manganese, phosphorus, and sulfur, with carbon equivalent playing a key role in solidification behavior. The following table summarizes typical properties relevant to gray iron casting:
| Property | Value | Unit |
|---|---|---|
| Tensile Strength | 250 | MPa |
| Hardness | 180-240 | HB |
| Carbon Content | 3.2-3.6 | % |
| Silicon Content | 1.8-2.4 | % |
| Eutectic Temperature | ~1150 | °C |
In gray iron casting, the solidification shrinkage is partially offset by graphite expansion, which can be quantified using the following relationship for volume change:
$$ \Delta V = V_l \cdot \beta_l + V_g \cdot \beta_g $$
where \( \Delta V \) is the net volume change, \( V_l \) is the volume of liquid, \( \beta_l \) is the liquid shrinkage coefficient, \( V_g \) is the volume of graphite, and \( \beta_g \) is the expansion coefficient due to graphite formation. For HT250, \( \beta_g \) typically ranges from 2% to 4%, aiding in self-feeding during solidification.
Casting Process Design Methodology
The casting process design began with determining the pouring position, parting surface, and gating system. Three potential pouring position schemes were evaluated based on casting principles. Scheme 1 positioned the critical base face downward, ensuring quality for major surfaces and facilitating core placement, though it required more molding inserts. Scheme 2 placed the largest thin-walled section at the bottom to enhance filling but risked defects on upper machining faces. Scheme 3 oriented key faces sideways but introduced challenges like overhanging cores. After analysis, Scheme 1 was selected for its balance of quality and manufacturability in this gray iron casting project.
The parting surface was set at the bottom plane of the bearing seat, enabling two-box molding with the entire casting in one half. This minimized dimensional errors and simplified mold assembly. For the gating system, a bottom-pouring closed design was adopted to ensure smooth metal flow and reduce turbulence. The cross-sectional area ratios for the gating system were set as:
$$ \sum S_{\text{sprue}} : \sum S_{\text{runner}} : \sum S_{\text{ingate}} = 1.15 : 1.1 : 1 $$
Using the Oseen formula for choke area calculation, the initial parameters were derived. For castings weighing between 100 kg and 1000 kg, the pouring time \( t \) (in seconds) can be estimated empirically:
$$ t = S_1 \cdot \sqrt[3]{G_L} $$
where \( S_1 \) is an empirical coefficient (taken as 1.7 for fast pouring) and \( G_L \) is the total mass of metal in the mold (in kg). With a casting mass of 566 kg and a pouring metal mass assumed as 1.2 times the casting mass (679.2 kg), the pouring time was calculated:
$$ t = 1.7 \times \sqrt[3]{679.2} \approx 46.4 \text{ s} $$
The choke area \( A_c \) was then computed based on flow rate considerations, resulting in \( A_c = 8.75 \text{ cm}^2 \). From the area ratios, the sprue cross-sectional area was \( A_s = 10.06 \text{ cm}^2 \), rounded to a diameter of 36 mm. The runner and ingate areas were subsequently determined as 9.63 cm² and 8.75 cm², respectively. The detailed dimensions are tabulated below:
| Gating Element | Cross-Sectional Shape | Dimensions (mm) | Area (cm²) |
|---|---|---|---|
| Sprue | Circular | Ø36 | 10.18 |
| Runner | Trapezoidal | Top: 40, Bottom: 30, Height: 25 | 9.63 |
| Ingate | Rectangular | Width: 35, Height: 25 | 8.75 |
This gating design aimed to minimize direct impact on thick sections, thereby reducing hot spot formation. The overall process layout ensured that molten iron would enter the mold cavity gradually from the bottom, promoting directional solidification and aiding in gas and slag removal—a critical aspect in gray iron casting.
Numerical Simulation Setup and Initial Analysis
To validate and refine the process, numerical simulation was performed using ProCAST software. The 3D model of the bearing seat was created in SolidWorks, imported into ProCAST, and meshed into surface and volume elements for finite element analysis. The simulation parameters were set as follows: pouring temperature of 1350°C, pouring time of 46.4 s, and initial mold and core temperatures of 20°C. These settings reflect typical conditions for gray iron casting production.
The filling process simulation revealed that molten iron began entering the cavity at 4.92 s, fully covered the bottom surface by 12.89 s, and completed filling at 47.71 s, closely matching the designed pouring time. Temperature distribution during filling showed minimal cooling in the early stages, with gradual temperature drop along the gating system. The filling time contour indicated uniform, layered advancement, avoiding turbulent flow that could cause defects. After filling, the solidification process was monitored. By 404 s, the ingates had solidified, cutting off liquid feeding and isolating liquid pools in thick sections. The solidification sequence highlighted five major hot spots, as illustrated in the thermal analysis, corresponding to areas prone to shrinkage defects in gray iron casting.
The initial simulation without risers predicted significant shrinkage porosity and cavities, predominantly in the thin-walled rear section and the central thickest region. The defect volume was concentrated in locations aligned with the identified hot spots, confirming the need for process optimization. The following table summarizes the key simulation parameters and observations:
| Parameter | Value | Note |
|---|---|---|
| Pouring Temperature | 1350 °C | Typical for HT250 |
| Pouring Time | 46.4 s | Calculated empirically |
| Mold Initial Temperature | 20 °C | Ambient condition |
| Filling Completion Time | 47.71 s | Close to design |
| Major Defect Locations | 5 hot spots | Central and rear thick zones |
Process Optimization via Riser and Chill Design
To address the predicted defects, the principle of directional solidification was applied by incorporating insulating risers and chills. Risers serve as reservoirs of molten metal to feed shrinkage during solidification, while chills accelerate cooling in specific regions to eliminate thermal gradients and promote sequential freezing. For gray iron casting, the design of these elements must account for the material’s self-feeding characteristics due to graphite expansion.
Two open-top insulating risers were designed using the proportional segment method. The riser dimensions were based on the hot spot diameters (T) of the casting. For the central thick section, the hot spot diameter \( T_1 = 66.5 \text{ mm} \), and for the rear section, \( T_2 = 50 \text{ mm} \). The riser diameter \( D_R \) and height \( H_R \) were calculated as:
$$ D_R = K \cdot T, \quad H_R = K \cdot D_R $$
where \( K \) is a coefficient ranging from 1.2 to 2.5, selected as 1.5 for this design. Thus:
For riser 1: \( D_{R1} = 1.5 \times 66.5 \approx 100 \text{ mm}, \quad H_{R1} = 1.5 \times 100 = 150 \text{ mm} \) (adjusted to mold height).
For riser 2: \( D_{R2} = 1.5 \times 50 = 75 \text{ mm}, \quad H_{R2} = 1.5 \times 75 = 112.5 \text{ mm} \).
The riser neck dimensions were derived as \( d = 0.9T \) and \( h = 0.3D_R \), resulting in \( d_1 = 59.85 \text{ mm}, h_1 = 35 \text{ mm} \) and \( d_2 = 45 \text{ mm}, h_2 = 26.25 \text{ mm} \).
Additionally, six external chills were designed with a thickness of 10 mm, placed strategically near thin-to-thick transitions to enhance cooling. The chill dimensions were determined based on casting geometry and thermal requirements, as per standard gray iron casting handbooks. The locations of risers and chills were optimized to ensure a temperature gradient favoring solidification from the extremities toward the risers.
The optimized design was simulated again. Results showed a reduction in defect volume and a shift of defects into the risers, indicating improved feeding. However, a significant defect remained near riser 1, as revealed by temperature field slicing. This area exhibited an elliptical high-temperature zone, leading to an isolated liquid pool. To further enhance the gray iron casting quality, a seventh chill (chill 7) with a thickness of 30 mm was added adjacent to riser 1, targeting that specific hot spot.
The table below outlines the riser and chill specifications used in the optimization:
| Element | Location | Dimensions (mm) | Purpose |
|---|---|---|---|
| Riser 1 | Central thick section | Ø100 × 150 | Feed main hot spot |
| Riser 2 | Rear section | Ø75 × 112.5 | Feed secondary hot spot |
| Chill 1-6 | Various thin walls | Thickness: 10 | Accelerate cooling |
| Chill 7 | Near riser 1 | Thickness: 30 | Eliminate residual hot spot |
Simulation Results and Discussion of Optimized Gray Iron Casting
The secondary optimization simulation demonstrated a substantial improvement. Defects were largely confined to the risers, with minimal shrinkage in the casting body. The temperature distribution during solidification became more uniform, and the sequential solidification pattern was achieved, confirming the effectiveness of the riser-chill combination in gray iron casting. The final defect prediction showed that the casting met quality requirements, with porosity volumes reduced to acceptable levels.
To quantify the improvement, a comparative analysis of defect volumes before and after optimization was performed. Although exact volumes are software-dependent, the trend indicated a reduction of over 80% in defect size within the casting. The following equation can be used to estimate the feeding efficiency \( \eta \) of the riser system:
$$ \eta = \frac{V_{\text{feed}}}{V_{\text{shrink}}} \times 100\% $$
where \( V_{\text{feed}} \) is the volume of metal fed from risers and \( V_{\text{shrink}} \) is the total shrinkage volume. In this gray iron casting, \( \eta \) approached 95% after optimization, highlighting the success of the design.
Moreover, the simulation provided insights into the solidification time gradients. The time for complete solidification \( t_s \) can be modeled using Chvorinov’s rule, modified for gray iron casting:
$$ t_s = B \cdot \left( \frac{V}{A} \right)^n $$
where \( B \) is a mold constant, \( V \) is volume, \( A \) is surface area, and \( n \) is an exponent (typically around 2). For the optimized casting, the \( V/A \) ratio was balanced across sections, reducing local variations and promoting healthy solidification.
The entire optimization process underscores the value of numerical simulation in gray iron casting. By iteratively adjusting risers and chills based on simulation feedback, the process achieved directional solidification without extensive physical trials. This approach is particularly beneficial for complex geometries like bearing seats, where wall thickness variations pose significant challenges.
Conclusion and Future Perspectives
In summary, this study detailed the optimization of a gray iron casting process for an upper bearing seat using numerical simulation. Through systematic design of pouring position, gating system, and solidification control elements, coupled with ProCAST simulations, the initial defect-prone process was refined into a robust one. The addition of two insulating risers and seven chills, followed by a secondary adjustment, effectively minimized shrinkage porosity and cavities, ensuring the casting’s integrity and performance. The gray iron casting methodology demonstrated here highlights how simulation tools can enhance traditional foundry practices, leading to higher quality, reduced costs, and shorter development cycles.
Future work could explore advanced aspects of gray iron casting, such as the impact of inoculation on graphite morphology and its simulation, or the integration of machine learning for automated optimization. Additionally, extending this approach to other grades of gray iron or larger production scales would further validate its applicability. Ultimately, the synergy between numerical simulation and gray iron casting continues to drive innovations in the manufacturing sector, paving the way for more reliable and efficient component production.