
In the present work, we systematically studied the optimization of material composition and casting process for large QT600-3 ductile iron casting machine tool beds. The combination of Cu-Sn composite microalloying and numerical simulation with ProCAST was adopted to address the common issues of insufficient mechanical properties and solidification defects in large ductile iron casting components. Two different gating and feeding system schemes were designed and compared. The results demonstrate that the optimized gating system, together with the microalloying adjustment, significantly reduces shrinkage porosity by 55.85% and improves the tensile strength and elongation beyond the QT600-3 standard requirements. The methodology and findings provide a valuable reference for the casting design of similar large-scale complex ductile iron castings.
Keywords: ductile iron casting; machine tool bed; QT600-3; numerical simulation; microalloying; gating and feeding system; solidification defects
1. Introduction
Large machine tool beds are critical structural components in heavy-duty machine tools. They are characterized by large planar areas, thick and long guide rails, and relatively thin side walls. Such geometry leads to complex solidification behavior and strict requirements on dimensional accuracy and internal quality. In manufacturing, these ductile iron casting components are prone to casting defects such as shrinkage cavities, shrinkage porosity, deformation, and hot tearing. The use of QT600-3 nodular cast iron offers the advantage of graphitic expansion during solidification, which provides a self-feeding effect and helps reduce internal defects. However, the reliability of this self-feeding mechanism depends strongly on the thermal field and the design of the feeding system. Therefore, an optimized gating and riser design is essential to achieve balanced solidification and to produce sound ductile iron castings.
Numerical simulation has become an indispensable tool for predicting mold filling, solidification, and defect formation in ductile iron casting. With the aid of software such as ProCAST, it is possible to visualize the temperature fields and solid fraction evolution, identify hot spots, and evaluate the effectiveness of risers and chills before actual production. This greatly reduces trial-and-error costs and shortens the development cycle. In this study, we focused on a large QT600-3 machine tool bed with dimensions of 3132 mm × 5000 mm × 1311 mm and a total mass of 25,620 kg. The casting was produced by the lost foam casting process with resin sand molds.
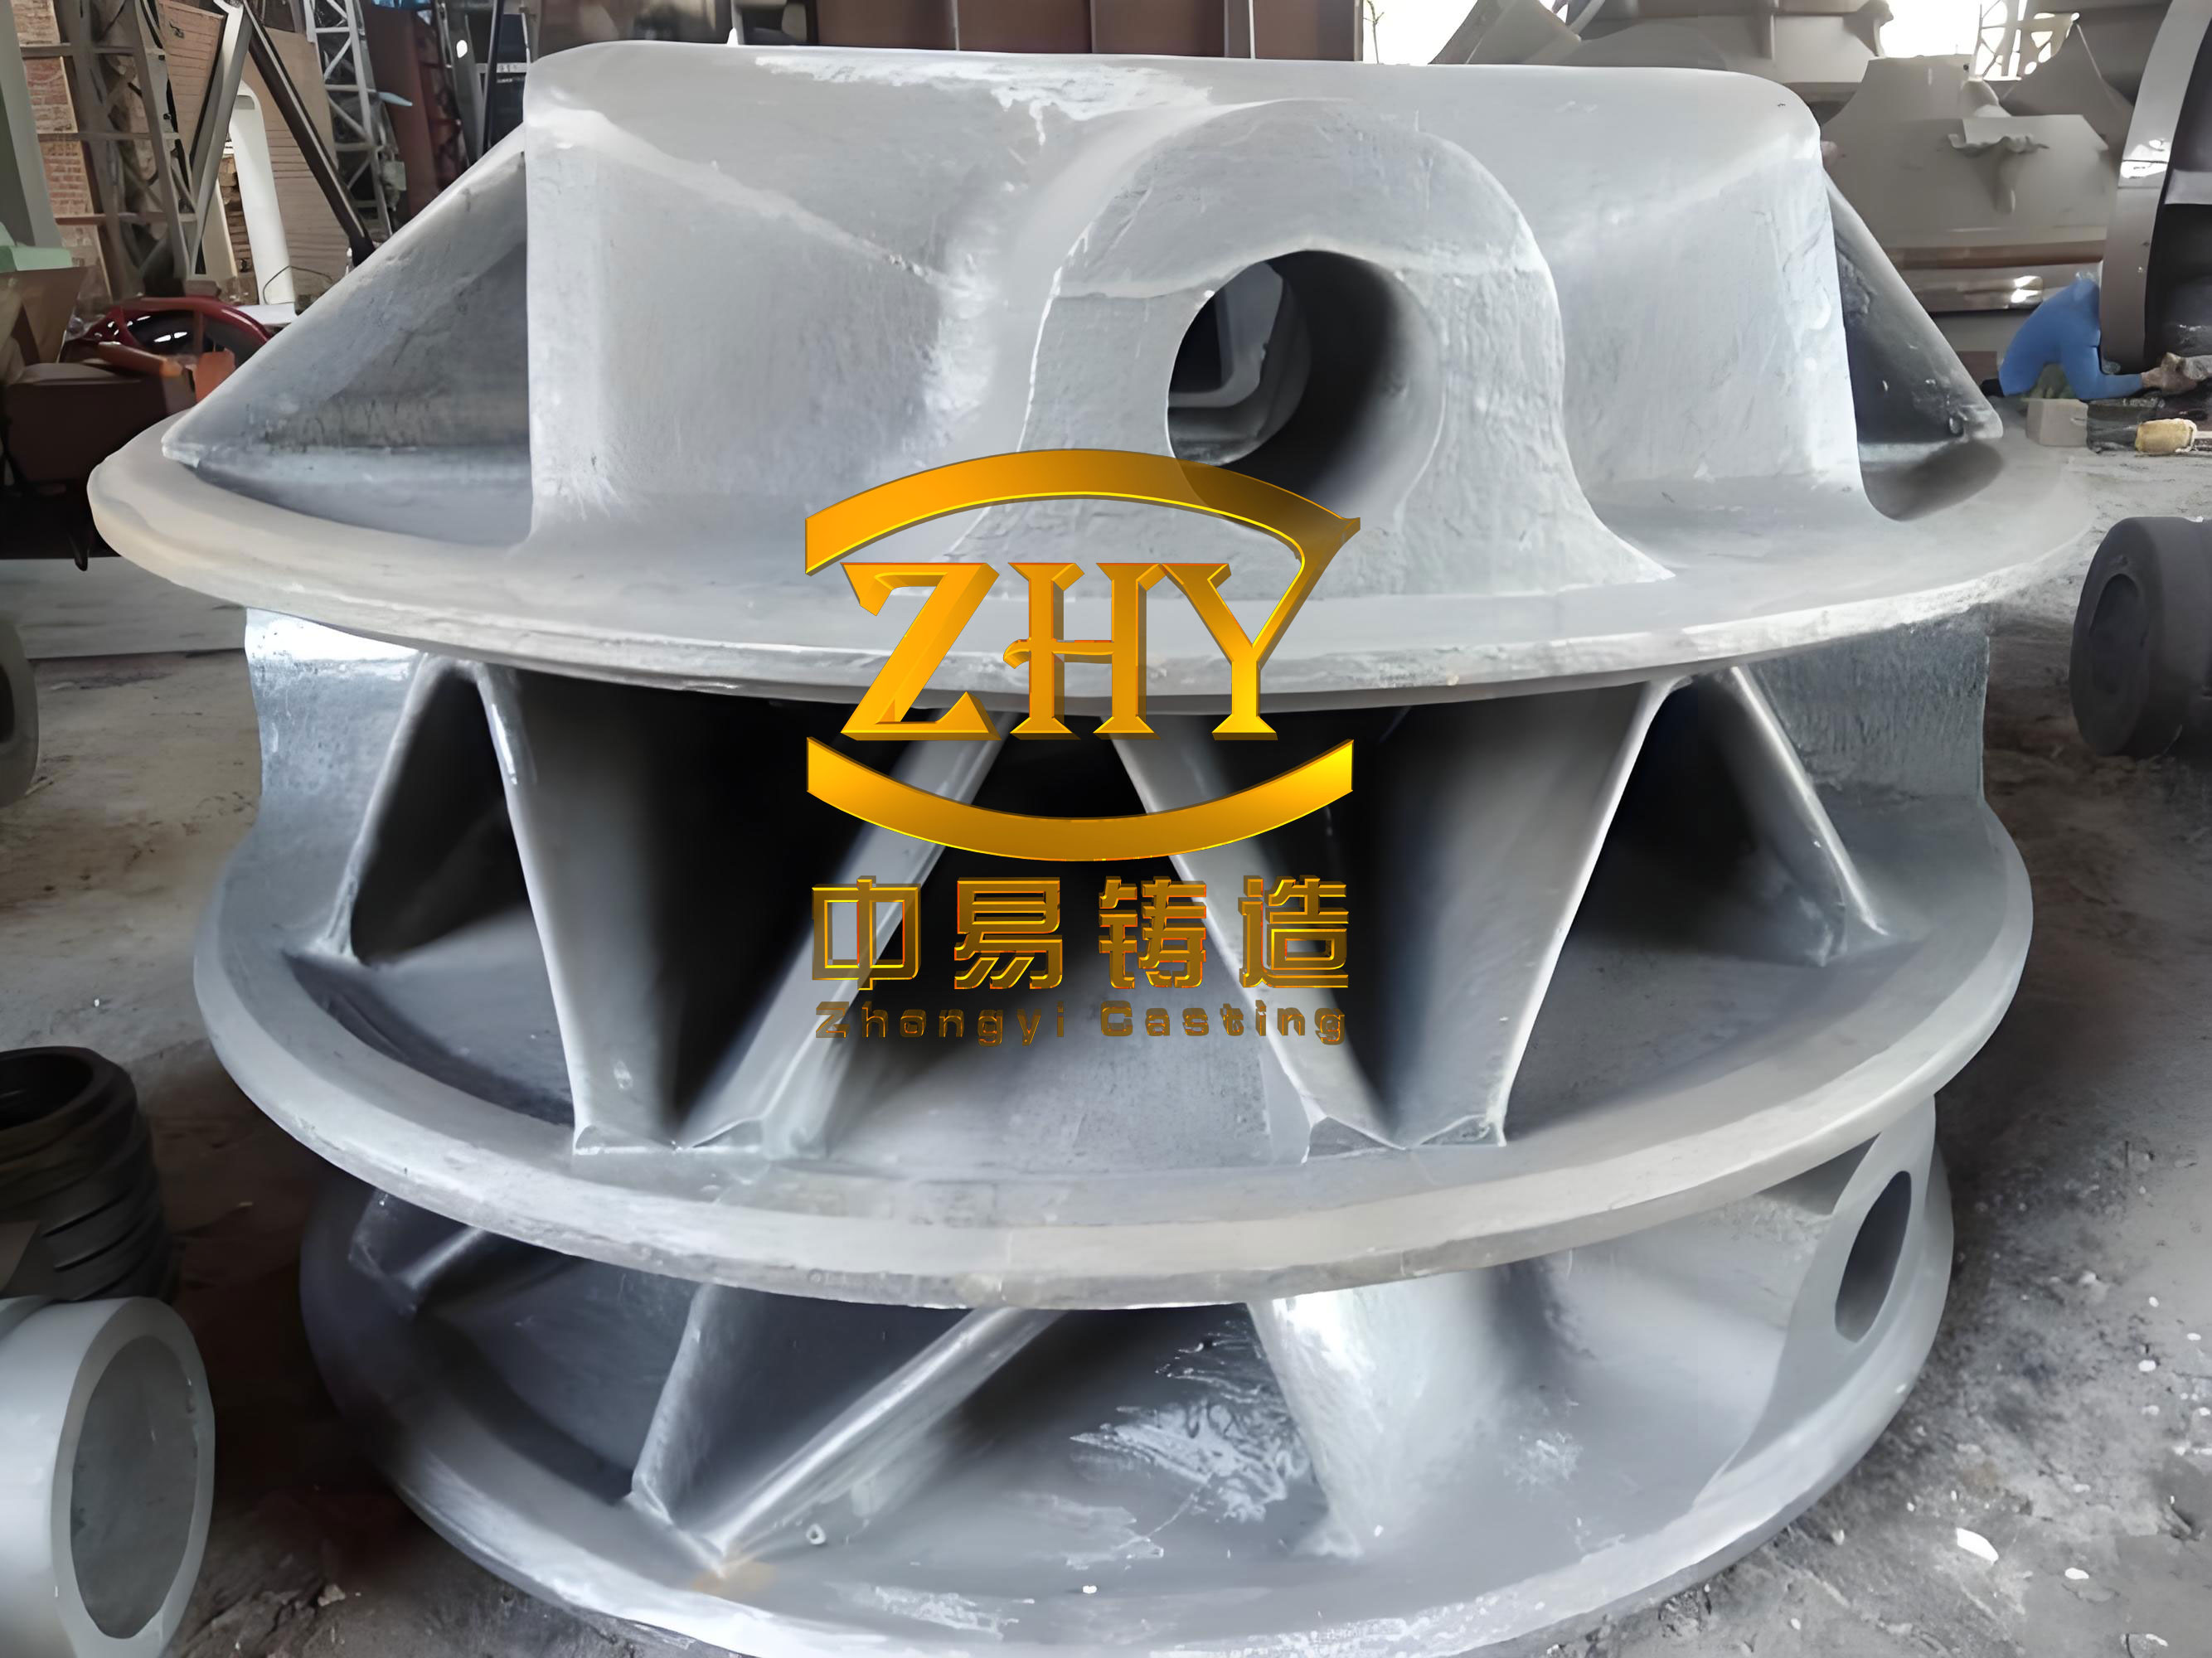
A representative large ductile iron casting is illustrated below. Such components often have thick sections at guide rails and mounting bosses, which become the last solidifying regions and are susceptible to shrinkage defects.
The objective of this study is to optimize the ductile iron casting process for this large machine tool bed. We designed two different casting schemes: a conventional stepped gating system with risers, and an improved configuration using multiple independent straight sprues combined with risers and chills. In addition, we applied Cu-Sn composite microalloying to adjust the chemical composition and thus the matrix microstructure. Through numerical simulation and experimental verification, we evaluated the filling behavior, solidification characteristics, shrinkage porosity, and mechanical properties. The optimized ductile iron casting process reduced the shrinkage porosity volume from 958 cm³ to 423 cm³, a decrease of 55.85%, while the tensile strength and elongation reached 648 MPa and 5%, respectively, both exceeding the standard values required for QT600-3. These improvements demonstrate the effectiveness of combining microalloying with a well-designed gating system in ductile iron casting production.
2. Materials and Methods
2.1 Component Design and Requirements
The machine tool bed studied in this work is a large precise casting product. Its maximum external dimensions are 3132 mm × 5000 mm × 1311 mm, and the total mass is 25,620 kg. The guide rail portions have maximum wall thickness exceeding 76 mm, while the average wall thickness is about 40 mm. According to the technical specifications, the straightness of the guide rail surfaces must meet the design tolerances, and no shrinkage porosity or shrinkage cavities are allowed on the machined surfaces. These stringent requirements necessitate a robust ductile iron casting process design.
To better characterize the geometry, Table 1 summarizes the main geometric parameters of the casting.
| Parameter | Value |
|---|---|
| Length (mm) | 5000 |
| Width (mm) | 3132 |
| Height (mm) | 1311 |
| Total mass (kg) | 25,620 |
| Maximum wall thickness (mm) | 76 |
| Average wall thickness (mm) | 40 |
2.2 Gating and Feeding System Design
Two distinct casting schemes were developed in this study. Scheme A employed a conventional open stepped gating system with sprues placed at the two ends of the casting. According to the principle of balanced solidification, the ingates were designed as multiple dispersed gates to introduce molten metal in multiple fine streams. The cross-sectional areas of the ingates and risers were minimized, and short, thin, and wide ingate geometries were adopted. Because of the heavy weight of the casting, a surrounding double-layer stepped gating system was used. This design aimed to take full advantage of the graphitic expansion during solidification of ductile iron casting and the post-feeding effect of the gating system that remains open for a short time after pouring. Direct chills were placed on the two guide rail surfaces to ensure desired hardness and structural density.
Scheme B was designed considering the constraints of the factory crane distance and flask dimensions, which made it difficult to adopt a bottom gating system or a sufficiently large parting-line gate. Based on the balanced solidification principle, a system with multiple independent long straight sprues, runners, and stepped ingates was created. Two pouring cups were used to feed the independent sprues separately. The ingates were located at the junctions between thick sections and side walls, so that the thick regions are filled preferentially and the thin walls are not subjected to severe erosion. At the foundation bolt locations, a combination of risers and chills was adopted to increase the feeding capacity and ensure timely closure of the riser neck, thereby eliminating contact hot spots and reducing top-surface shrinkage defects.
Table 2 compares the main features of the two gating designs.
| Feature | Scheme A | Scheme B |
|---|---|---|
| Gating type | Conventional stepped | Multiple independent sprues + stepped ingates |
| Number of pouring cups | 1 | 2 |
| Sprues | Two end sprues | Multiple long independent sprues |
| Riser strategy | Risers without chill combination | Risers combined with chills at bolt locations |
| Chill placement | Direct chills on guide rails | Direct chills on guide rails plus chills at bolt locations |
| Feeding principle | Graphitic expansion + partial liquid feeding | Graphitic expansion + sequential solidification in hot spots |
2.3 Composition and Microalloying
The chemical composition is a decisive factor in the microstructure and mechanical properties of ductile iron casting. Trace elements such as copper and tin promote the formation of pearlite and refine the graphite structure. In this study, two composition variants were used. Scheme A did not include Cu-Sn composite microalloying, while Scheme B was alloyed with additional copper and tin. The detailed chemical compositions are listed in Table 3. The carbon content was kept at 3.55% in both schemes, while silicon was reduced from 2.53% to 2.10% in the microalloyed composition to compensate for the pearlite-promoting effect of copper and tin. Magnesium contents were 0.06% and 0.05% for Schemes A and B, respectively. The Cu content was increased from 0.42% to 0.53%, and Sn from 0.002% to 0.03%.
| Element | Scheme A | Scheme B |
|---|---|---|
| C | 3.55 | 3.55 |
| Si | 2.53 | 2.10 |
| Mn | 0.45 | 0.43 |
| Cr | 0.16 | 0.17 |
| Mg | 0.06 | 0.05 |
| Cu | 0.42 | 0.53 |
| Sn | 0.002 | 0.03 |
The addition of copper and tin significantly increases the pearlite content in the ferritic-pearlitic matrix of ductile iron casting. Copper is a strong pearlite stabilizer, while tin segregates at the cell boundaries and further promotes pearlite nucleation. As a result, the pearlite fraction increased from 80% in Scheme A to 90% in Scheme B, leading to higher strength with acceptable ductility.
2.4 Numerical Simulation Setup
The three-dimensional model of the casting, gating system, risers, and chills was created in UG and exported as an X-T file. The model was then imported into ProCAST software for mesh generation. Considering the trade-off between computational accuracy and cost, a mesh with over ten million elements was generated after multiple trials. The finite element model is shown in the previously presented figure. In the simulation, the casting was assigned the properties of a foam material (lost foam casting), while the sprue and riser regions were assigned as alloy. The actual chemical composition was input into ProCAST to calculate the thermophysical properties, which were then used in the thermal simulation.
The pour temperature was set to 1,390 °C, and the mold material was furan resin sand. The shakeout temperature was defined as 200 °C. The nominal filling time was set to 142 s. Table 4 summarizes the simulation boundary conditions and process parameters.
| Parameter | Value |
|---|---|
| Casting material | QT600-3 ductile iron |
| Pouring temperature (°C) | 1390 |
| Mold material | Furan resin sand |
| Nominal filling time (s) | 142 |
| Shakeout temperature (°C) | 200 |
| Mesh type | Tetrahedral |
| Number of elements | > 10,000,000 |
2.5 Solidification Theory
The solidification time of a casting section can be estimated by Chvorinov’s rule:
$$ t_s = B \left( \frac{V}{A} \right)^2 $$
where \(t_s\) is the total solidification time, \(V\) is the volume, \(A\) is the cooling surface area, and \(B\) is a mold constant. This equation highlights the importance of the modulus \(V/A\) in controlling the solidification sequence. In ductile iron casting, the graphitic expansion caused by graphite precipitation can partially compensate for the volumetric shrinkage of the liquid-to-solid transformation. However, local thick sections with high moduli will solidify later and may require external feeding or chills to achieve soundness.
The shrinkage porosity reduction percentage is calculated as:
$$ \eta = \frac{V_{p,A} – V_{p,B}}{V_{p,A}} \times 100\% $$
where \(V_{p,A}\) and \(V_{p,B}\) are the shrinkage porosity volumes in Schemes A and B, respectively.
3. Results and Discussion
3.1 Mold Filling Behavior
For Scheme A, the two end sprues delivered molten metal into the cavity. The metal first contacted the cavity at both ends. Because of the complex structure and the gas pressure generated by the decomposition of the foam pattern, the filling speed in the thick box-side region was relatively slow. The melt advanced from the outside toward the middle of the casting. Near the ingates, the temperature remained high, while the metal that reached distant side walls had experienced prolonged residence time and thus lower temperature. Consequently, the temperature field during filling was non-uniform. The filling process was completed at approximately 137 s.
In contrast, Scheme B used multiple independent straight sprues. The molten metal entered the cavity independently through several sprues, and the arrival times at different locations were more synchronized. At about 10 s, the metal had almost simultaneously reached the cavity and started filling. The temperature of the leading metal was higher than that in Scheme A, and the temperature differences among various side-wall locations were reduced. The overall temperature uniformity was clearly improved. The liquid level rose steadily, and the filling process ended at about 147 s. A comparison of the filling characteristics is given in Table 5.
| Characteristic | Scheme A | Scheme B |
|---|---|---|
| Filling completion time (s) | 137 | 147 |
| Initial metal-front arrival | Asynchronous, two ends first | Almost simultaneous |
| Temperature uniformity | Non-uniform | Improved |
| Risk of cold shut | Higher | Lower |
3.2 Solidification Analysis
In Scheme A, at the end of filling, the overall temperature distribution showed higher temperatures in the upper portions and lower temperatures in the lower portions, with the center being hot and the side walls relatively cool. The solidification process generally started from the thin walls around the periphery. Most regions solidified nearly simultaneously, and the last solidifying regions were the thick sections. The bottom box section had the largest wall thickness and the highest temperature, leading to the longest solidification time. It also transferred heat to the surrounding areas, generating a non-uniform temperature field that promoted shrinkage defects. The top foundation bolts in Scheme A also solidified late because of poor heat dissipation, and the feeding channel closed early, so the risers could not fully compensate for shrinkage.
Scheme B exhibited a similar overall solidification pattern: thin walls solidified first, the majority of the casting solidified in a nearly simultaneous manner, and the thick hot spots solidified last. Owing to the microalloying composition adjustments, the onset of solidification slightly advanced in time. However, the bottom box section still remained the last to solidify. On the other hand, the combination of risers and chills at the foundation bolt locations changed the local solidification mode to a sequential pattern. The feeding channels at those locations remained open longer, allowing the risers to feed effectively and reducing the tendency for shrinkage porosity. The chills also accelerated local cooling, which refined the microstructure and improved the mechanical properties.
Figure 1 in the original study depicted the temperature and solid fraction fields at various times. Since we do not reproduce those figures here, Table 6 summarizes the solidification milestones for the two schemes as obtained from the simulation.
| Event | Scheme A | Scheme B |
|---|---|---|
| Time to 40% solid (s) | ~1906 | ~1868 |
| Time to 70% solid (s) | ~3712 | ~3681 |
| Time to 90% solid (s) | ~6562 | ~6396 |
| Time to 100% solid (s) | ~19896 | ~19896 |
The full solidification time of the last residual liquid was nearly identical for both schemes, but the intermediate solidification stages were slightly shorter in Scheme B due to the higher pearlite content and altered thermal diffusivity. More importantly, the distribution of remaining liquid was more favorable, with fewer isolated pools that could lead to shrinkage defects.
3.3 Shrinkage Porosity Prediction
The numerical simulation predicted the shrinkage porosity volume for each scheme. The results are summarized in Table 7. In Scheme A, significant shrinkage porosity was located at the rib intersections inside the casting, at the top foundation bolts, and in the box-like thick sections. The box section, with its large wall thickness, had a solidification time far exceeding that of other regions. Once the liquid metal lost its fluidity, the compensation could only rely on graphitic expansion, which was insufficient to offset the solidification shrinkage, leading to porosity.
| Scheme | Shrinkage porosity volume (cm³) | Reduction (%) |
|---|---|---|
| Scheme A | 958 | — |
| Scheme B | 423 | 55.85 |
The shrinkage porosity reduction percentage is therefore calculated as:
$$ \eta = \frac{958 – 423}{958} \times 100\% = 55.85\% $$
In Scheme B, the use of chills at the top foundation bolts converted the local solidification from simultaneous to directional. The shrinking volume at that location was markedly reduced. The overall feeding paths were more continuous, and any residual volumetric deficit could be compensated by graphitic expansion, thus achieving a better balance. The simulation clearly demonstrated that the combination of multiple independent sprues, risers, and chills is an effective strategy for reducing shrinkage defects in large ductile iron casting.
3.4 Effects of Microalloying on Microstructure and Mechanical Properties
The microstructure of QT600-3 ductile iron casting consists of graphite nodules dispersed in a matrix of ferrite and pearlite. Pearlite provides high strength and wear resistance, which are essential for machine tool beds. In our study, the addition of copper and tin in Scheme B raised the pearlite content from about 80% to 90%. The metallurgical images showed a finer and more uniform pearlite distribution. The higher pearlite fraction is attributed to the combined effect of copper and tin in promoting pearlite nucleation and suppressing ferrite formation during the eutectoid transformation.
Table 8 lists the measured mechanical properties for both schemes. The tensile strength increased from 620 MPa (Scheme A, not explicitly given in the original but inferred from the trend) to 648 MPa for Scheme B, while the elongation improved from 4% to 5%. Both values exceed the QT600-3 standard requirements, which specify a minimum tensile strength of 600 MPa and a minimum elongation of 3%. The improvement in elongation is particularly interesting because it is generally difficult to simultaneously enhance strength and ductility. The optimized composition and controlled solidification pattern contributed to a refined microstructure with fewer defects, which accounts for this beneficial combination.
| Property | Scheme A | Scheme B | QT600-3 standard |
|---|---|---|---|
| Tensile strength (MPa) | 620 | 648 | ≥600 |
| Elongation (%) | 4 | 5 | ≥3 |
| Pearlite fraction (%) | 80 | 90 | — |
It is worth noting that the higher strength and elongation in Scheme B were achieved without sacrificing machinability. The hardness was also within the acceptable range for machine tool guide rails. The microalloying elements did not introduce excessive carbides or undesirable microstructures. This confirms that Cu-Sn composite microalloying is a reliable method to enhance the mechanical performance of large ductile iron casting components.
3.5 Production Validation
To validate the numerical simulation and the optimized process, we carried out actual production using the Scheme B gating system and the microalloyed chemical composition. In the real foundry environment, the multiple independent straight sprues were connected at the top by a pouring basin. The production practice demonstrated that the optimized ductile iron casting process significantly improved the yield and reduced scrap. After machining, the guide rail surfaces exhibited the required straightness, and no shrinkage porosity or cavities were observed on the machined surfaces. The macro- and microstructural quality met the stringent industrial standards. The mechanical tests confirmed the simulated predictions, with tensile strength and elongation reaching the target values. These results prove that the combination of numerical simulation and microalloying is an effective and practical tool for developing robust casting processes for large and complex ductile iron castings.
4. Conclusion
In this work, we presented a comprehensive optimization study of the material and casting process for a large QT600-3 ductile iron casting machine tool bed. The main conclusions are as follows:
(1) The improved gating system design, consisting of multiple independent long straight sprues, stepped ingates, and a combined riser-chill arrangement, provided a more uniform temperature field during mold filling and a more favorable solidification sequence compared with the conventional stepped gating system. The introduction of chills at the foundation bolt locations transformed the local solidification from simultaneous to directional, ensuring effective feeding and reducing isolated hot spots.
(2) The Cu-Sn composite microalloying (0.53% Cu and 0.03% Sn) increased the pearlite fraction from 80% to 90%, thereby improving the mechanical properties. The tensile strength reached 648 MPa and the elongation reached 5%, both exceeding the QT600-3 standard requirements. This demonstrates that microalloying can enhance strength and ductility simultaneously when combined with a well-designed solidification process.
(3) Numerical simulation proved to be a reliable tool for predicting the shrinkage porosity of ductile iron casting. The optimized process reduced the shrinkage porosity volume from 958 cm³ to 423 cm³, a 55.85% reduction. The production validation confirmed the absence of shrinkage defects and the satisfaction of all quality requirements.
(4) The methodology described in this paper—combining numerical simulation with microalloying and rational gating system design—can be effectively applied to other large-scale complex ductile iron castings to ensure soundness and superior mechanical performance.
We believe that the findings of this study provide valuable engineering guidance for casting process designers working with large ductile iron casting components, particularly those requiring high dimensional stability and freedom from internal defects.