
Lost foam casting (LFC) represents a revolutionary approach in metal forming technology, combining precision and efficiency through its unique foam pattern decomposition process. This advanced casting method eliminates traditional cores and binders, achieving complex geometries with exceptional dimensional accuracy.
1. Fundamental Process Flow
The lost foam casting sequence comprises five critical phases:
| Stage | Key Parameters | Control Targets |
|---|---|---|
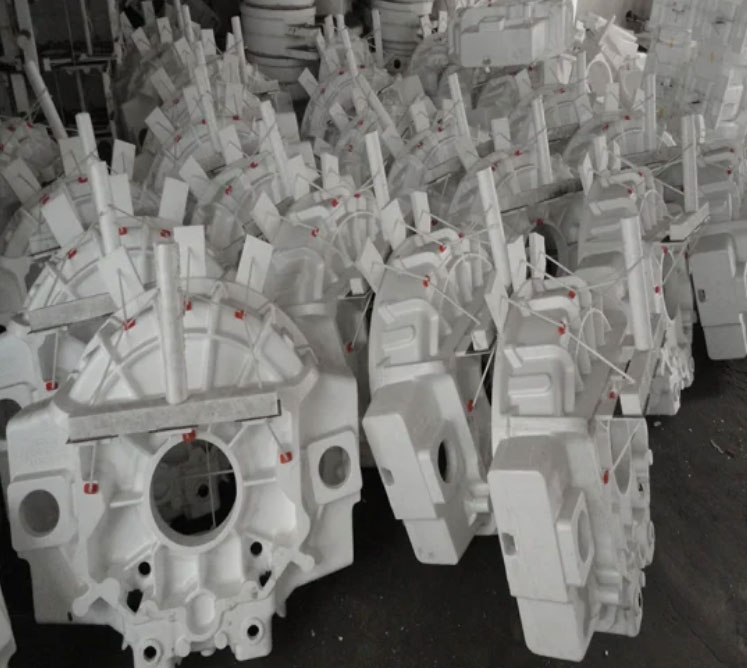
| Pattern Creation | EPS density: 16-24 kg/m³ | ±0.5% dimensional tolerance |
| Coating Application | Viscosity: 35-45 sec (Ford #4 cup) | 0.8-1.2 mm coating thickness |
| Mold Assembly | Vibration frequency: 50-60 Hz | ≥95% sand compaction |
| Metal Pouring | Pouring superheat: 30-50°C | 0.8-1.2 m/s filling velocity |
| Cooling & Extraction | Cooling rate: 1-3°C/s | Residual stress < 50 MPa |
2. Mathematical Modeling of Pattern Degradation
The thermal decomposition of EPS patterns follows Arrhenius-type kinetics:
$$ \frac{d\alpha}{dt} = A(1-\alpha)^n \exp\left(-\frac{E_a}{RT}\right) $$
Where:
α = Conversion degree (0 ≤ α ≤ 1)
A = Pre-exponential factor (1.5×10⁵ s⁻¹)
Ea = Activation energy (120 kJ/mol)
n = Reaction order (1.2)
R = Universal gas constant
T = Absolute temperature
3. Process Advantages and Limitations
| Advantages | Challenges |
|---|---|
| • 40-60% reduction in machining requirements • 15-30% energy savings vs. sand casting • Surface roughness Ra 6.3-12.5 μm |
• Higher pattern costs (20-35% of total) • Limited to 0.5-500 kg castings • Specialized coating requirements |
4. Thermal Dynamics of Metal Infiltration
The liquid metal front progression in lost foam casting can be modeled as:
$$ v(t) = \sqrt{\frac{2\gamma_{lv}\cos\theta}{\mu}} \cdot \sqrt{\frac{t}{r_p}} $$
Where:
γlv = Liquid-vapor surface tension
θ = Contact angle
μ = Dynamic viscosity
rp = Pore radius in coating
5. Industrial Implementation Metrics
| Application | Production Rate | Dimensional Accuracy | Yield Improvement |
|---|---|---|---|
| Automotive Cylinder Heads | 120-150 units/hr | CT6-7 | 18-22% |
| Pump Housings | 80-100 units/hr | CT7-8 | 25-30% |
| Valve Bodies | 60-75 units/hr | CT8-9 | 15-18% |
6. Environmental Impact Analysis
The ecological footprint of lost foam casting demonstrates significant advantages:
$$ \text{CO}_2 \text{ Emission Factor} = 1.2 – 1.8 \frac{\text{kg}}{\text{kg casting}} $$
Comparatively:
• Green sand casting: 2.1-2.8 kg/kg
• Die casting: 1.6-2.2 kg/kg
7. Quality Control Parameters
Critical process control metrics in lost foam casting include:
$$ \text{Porosity Index} = 0.15\sqrt{t_c} + 0.03(T_p – T_{\text{cut}}) $$
Where:
tc = Coating thickness (mm)
Tp = Pouring temperature (°C)
Tcut = Liquidus temperature (°C)
8. Future Development Trends
| Innovation Area | Current Status | 2025 Projection |
|---|---|---|
| 3D Printed Patterns | 15-20% adoption | 40-50% adoption |
| AI Process Control | R&D phase | 30% implementation |
| Hybrid Coating Systems | 5-8% usage | 25-30% usage |
The lost foam casting process continues to evolve through material science advancements and digital integration, maintaining its position as a cornerstone technology in precision metal forming. As manufacturing demands increasingly prioritize complex geometries and sustainable production, LFC demonstrates remarkable adaptability across multiple industrial sectors.