
Sand casting is one of the oldest and most widely used manufacturing processes for producing sand casting parts with complex geometries and various sizes. The quality of sand casting parts is significantly influenced by the thermal and mechanical phenomena during solidification and subsequent cooling. In particular, the residual stress and deformation that develop during these processes can lead to defects such as hot tearing, distortion, and cracking, thereby reducing the dimensional accuracy and service life of the final components. Therefore, the numerical simulation of the thermal stress field is of great importance for optimizing casting processes and improving the reliability of sand casting parts.
In this thesis, I focus on the numerical simulation technology of the thermal stress field in sand casting parts. The work is based on the finite element method (FEM) and the commercial software ANSYS. I present a detailed study of the transient temperature field and the subsequent thermal stress analysis using a sequentially coupled thermal-structural approach. The mechanical behavior of the casting alloy is described by a thermo-elasto-plastic constitutive model, and special attention is paid to the treatment of phase change, latent heat, and the interaction between the casting and the sand mold. The reliability of the proposed method is validated by simulating a typical stress frame casting, and the applicability is demonstrated by analyzing a real seat casting product.
1. Introduction
The numerical simulation of casting solidification has developed rapidly since the 1960s. Initially, researchers focused on temperature field simulation, followed by fluid flow simulation. The stress and strain field simulation, however, lagged behind due to its complexity. The thermal stress field involves highly nonlinear material behavior, phase transformations, and coupled thermo-mechanical interactions. With the advancement of computational techniques, the simulation of stress fields in sand casting parts has become a research hotspot, as it enables engineers to predict residual stresses, deformation, and hot cracks, thereby providing a scientific basis for process optimization.
Many studies have been carried out both domestically and internationally to simulate the stress evolution during casting. Some researchers used thermos-elastic models, while others adopted thermo-elasto-plastic or thermo-visco-plastic models. The most common numerical method is the finite element method due to its flexibility in handling complex geometries and boundary conditions. In recent years, commercial software such as ANSYS, ABAQUS, and MARC have become powerful tools for this purpose. However, the accuracy of the simulation depends strongly on the material properties at elevated temperatures, the treatment of the casting/mold interface, and the numerical algorithms for nonlinear problems.
The objective of my research is to establish a practical numerical simulation procedure for the thermal stress field of sand casting parts using ANSYS. I chose a sequentially coupled approach: first, the transient temperature field is computed; then, the nodal temperatures are applied as body loads in a structural analysis. This approach is acceptable because the deformation during solidification is usually small, and the heat generated by plastic work is negligible compared with the heat released during cooling and solidification. In the following sections, I will describe the mathematical model, the numerical implementation, and the simulation results for a typical stress frame and a real seat casting.
2. Mathematical Model of Thermal Stress Field
2.1 Heat Conduction Equation
The temperature field during casting is governed by the three-dimensional, transient heat conduction equation, which can be written in the form
$$
\rho c_{p} \frac{\partial T}{\partial t} = \nabla \cdot (k \nabla T) + q_{B}
$$
where \(\rho\) is the density, \(c_{p}\) is the specific heat at constant pressure, \(T\) is the temperature, \(t\) is the time, \(k\) is the thermal conductivity, and \(q_{B}\) is the internal heat source term. In the solidification interval, the release of latent heat acts as a distributed heat source. I used the enthalpy method to account for this effect, where the enthalpy \(H\) is defined as
$$
H(T) = \int_{T_{0}}^{T} \rho c_{p}(\tau) d\tau
$$
The latent heat is then included by defining the enthalpy as a function of temperature, which is a built-in capability of ANSYS.
2.2 Thermal and Mechanical Boundary Conditions
The initial condition for the casting system is given by the pouring temperature of the metal and the initial temperature of the sand mold. In my simulations, I assumed that the mold is initially at room temperature, and the metal is instantaneously filled at the pouring temperature. The boundary conditions at the outer surface of the sand mold include both convection and radiation to the environment. To simplify the calculation, the radiation effect is approximated by an equivalent convection coefficient.
For the stress analysis, the mechanical boundary conditions involve the interaction between the casting and the sand mold. In sand casting, the sand mold is generally not perfectly rigid; it provides some resistance to the contraction of the casting. However, for many practical cases, especially when the sand has good high-temperature collapsibility, the resistance can be neglected. In this study, I assumed that the sand mold is perfectly collapsible, meaning that it does not impose any mechanical constraint on the casting. Therefore, only the self-constraint due to non-uniform cooling within the casting is considered.
2.3 Thermo-Elasto-Plastic Constitutive Model
The mechanical behavior of the casting alloy is described by an incremental thermo-elasto-plastic model. The total strain increment is decomposed into elastic, plastic, and thermal components:
$$
d\varepsilon_{ij} = d\varepsilon_{ij}^{e} + d\varepsilon_{ij}^{p} + d\varepsilon_{ij}^{T}
$$
The elastic strain increment is related to the stress increment by Hooke’s law, which in the presence of temperature-dependent material properties can be written as
$$
d\sigma_{ij} = D_{ijkl}^{e} (d\varepsilon_{kl} – d\varepsilon_{kl}^{p} – d\varepsilon_{kl}^{T})
$$
where \(D_{ijkl}^{e}\) is the elastic constitutive matrix. The thermal strain increment is given by
$$
d\varepsilon_{ij}^{T} = \alpha(T) \delta_{ij} dT
$$
where \(\alpha\) is the coefficient of thermal expansion and \(\delta_{ij}\) is the Kronecker delta.
For the plastic part, I employed the von Mises yield criterion and the associated flow rule. The yield condition is expressed as
$$
\sigma_{eq} = \sqrt{\frac{3}{2} s_{ij} s_{ij}} = \sigma_{y}(T)
$$
where \(s_{ij}\) is the deviatoric stress tensor and \(\sigma_{y}\) is the temperature-dependent yield strength. The plastic strain increment is obtained from the flow rule:
$$
d\varepsilon_{ij}^{p} = d\lambda \frac{\partial F}{\partial \sigma_{ij}}
$$
where \(F\) is the yield function and \(d\lambda\) is the plastic multiplier. To simplify the material model, I used a bilinear isotropic hardening model, where the yield strength and tangent modulus are input as functions of temperature.
The incremental form of the constitutive equation can be expressed as
$$
d\sigma = D_{ep} (d\varepsilon – d\varepsilon^{T})
$$
where \(D_{ep}\) is the elasto-plastic stiffness matrix. This formulation was implemented in ANSYS using the built-in bilinear hardening option.
3. Temperature Field Simulation of a Stress Frame
3.1 Geometry and Meshing
To validate the numerical procedure, I first simulated a typical stress frame casting, which is commonly used to study thermal stresses in sand casting parts. The stress frame has two vertical bars of different thicknesses connected by a crossbar. The thick bar cools slower than the thin bar, leading to a characteristic stress distribution. The geometry dimensions are shown in Table 1. The casting material is ZG25 carbon steel, and the sand mold is made of water glass quartz sand. The pouring temperature is 1670°C, and the initial mold temperature is 25°C.
| Parameter | Value (mm) |
|---|---|
| Total height | 200 |
| Total width | 160 |
| Thick bar width | 40 |
| Thin bar width | 10 |
| Bar length (horizontal) | 120 |
| Mold outer dimensions | 300 × 400 × 140 |
The three-dimensional solid model was created in Pro/E and then imported into ANSYS. The element type SOLID70, which is an 8-node thermal element, was used for the temperature field analysis. The casting was meshed with an element size of 8 mm, while the sand mold was meshed with a coarser size of 20 mm to reduce computational cost. The finite element model is shown in Figure 1 (not displayed here).
3.2 Material Properties
The thermal properties of the sand mold were assumed to be constant and are listed in Table 2. For the casting material ZG25, the thermal conductivity and enthalpy were temperature-dependent. Table 3 gives the values used in the simulation.
| Property | Value |
|---|---|
| Thermal conductivity (W/m·°C) | 0.52 |
| Density (kg/m³) | 1630 |
| Specific heat (J/kg·°C) | 1120 |
| Temperature (°C) | Conductivity (W/m·°C) | Enthalpy (J/m³ × 10⁹) | Specific heat (kJ/kg·°C) |
|---|---|---|---|
| 25 | 62.5 | 0 | 0.287 |
| 1460 | 65.2 | 8.24 | 0.581 |
| 1520 | 58.2 | 10.5 | 0.586 |
| 1670 | 58.2 | 11.4 | 0.668 |
3.3 Initial and Boundary Conditions
The initial temperature field was obtained by a steady-state analysis with a very short time step of 0.01 s, after which the transient analysis began. During the transient analysis, the time step was set to 5 s, and the total cooling time was 6000 s. The boundary conditions at the outer surfaces of the sand mold were treated as a combined convection and radiation condition, with an equivalent convective heat transfer coefficient of \(h = 10 \, \text{W/m}^2\text{·°C}\) and an ambient temperature of 25°C. The interface between the casting and the mold was assumed to be in perfect contact, so only conduction is considered.
3.4 Results of Temperature Field
Several time steps were extracted to show the evolution of the temperature distribution. At 10 s, the thin bar cools rapidly to about 1654°C, while the center of the thick bar remains at 1664°C. The corners in contact with the mold have even lower temperatures. At 300 s, the thin bar has solidified and its temperature drops to 774°C, whereas the thick bar still has a liquid core with a maximum temperature of about 1560°C. At 600 s, the thin bar temperature is around 272°C, and the thick bar is in the solidification zone with temperatures ranging from 1116°C to 1357°C, with the highest temperature at the center. At 800 s, the entire frame is essentially solid; the thin bar cools to 139°C while the thick bar maximum temperature is about 1103°C. As cooling continues, the temperature difference between the thick and thin bars gradually decreases. By 1800 s, the thin bar is at 35°C and the thick bar center is at 383°C. After 6000 s, the whole system reaches near-room temperature, with a maximum difference of about 3°C.
The simulation results show that the cooling process is highly non-uniform, which is the primary cause of thermal stress. The temperature gradient is largest in the early stages and gradually diminishes. This behavior is consistent with the results obtained by other researchers using different simulation codes.
4. Stress Field Simulation
4.1 Analysis Procedure
I used the indirect method in ANSYS to perform the thermal stress analysis. After the temperature field was obtained, the thermal element SOLID70 was converted to the corresponding structural element SOLID45, which has three translational degrees of freedom at each node. The nodal temperatures from the thermal analysis were then read as body loads in the structural model. The material mechanical properties required for the stress analysis include the elastic modulus, Poisson’s ratio, coefficient of thermal expansion, yield strength, and tangent modulus, all as functions of temperature. These were taken from published data for ZG25 steel and are listed in Tables 4 and 5.
| Temperature (°C) | Elastic modulus (GPa) | Poisson’s ratio | Yield strength (MPa) | Tangent modulus (GPa) |
|---|---|---|---|---|
| 25 | 184 | 0.278 | 240 | 5.2 |
| 200 | 168 | 0.303 | 205 | 4.8 |
| 400 | 102 | 0.310 | 160 | 4.2 |
| 600 | 50 | 0.327 | 120 | 3.1 |
| 800 | 8.5 | 0.344 | 90 | 1.2 |
| 1000 | 5.5 | 0.360 | 74 | 0.26 |
| 1200 | 0.5 | 0.377 | 50 | 0.008 |
| 1400 | 0.048 | 0.390 | 30 | 0.0002 |
| Temperature (°C) | CTE (×10⁻⁵ /°C) |
|---|---|
| 25 | 1.4 |
| 200 | 1.5 |
| 400 | 1.6 |
| 600 | 1.7 |
| 800 | 1.8 |
| 1000 | 2.0 |
| 1200 | 2.2 |
| 1400 | 2.3 |
4.2 Special Treatments in the Stress Analysis
Several numerical treatments were adopted to improve convergence and accuracy. First, the material model was defined as an isotropic elasto-plastic material with bilinear hardening, using the von Mises yield criterion. Second, special attention was paid to the transition elements that pass from the elastic to the plastic state during an incremental load step. A weighting coefficient \(m\) was introduced to avoid numerical problems. The corrected weighting coefficient is given by
$$
m = \frac{\sigma_{y1}(\sigma_{2} – \sigma_{1}) + \sigma_{1}(\sigma_{y1} – \sigma_{y2})}{\sigma_{1}\sigma_{2} – \sigma_{y1}\sigma_{y2}}
$$
where \(\sigma_{1}\) and \(\sigma_{2}\) are the equivalent stresses at the previous and current steps, and \(\sigma_{y1}\) and \(\sigma_{y2}\) are the corresponding yield stresses.
Third, at temperatures close to the melting point, the elastic modulus and yield strength are very small. To avoid unreasonable stress increases, I ensured that the change in stress due to the temperature dependence of the modulus satisfies
$$
\frac{dE}{dT} \leq \frac{2 \sigma_{y}}{E \alpha}
$$
Finally, the time step for the stress analysis was set to 10 s, which was smaller than that used in the temperature analysis (5 s) to ensure that the temperature load increments were sufficiently small.
4.3 Results of Thermal Stress Field
The stress field at different times during cooling was obtained. At 1000 s, the thin bar is in tension, while the thick bar is in compression. This is because the thin bar cools faster and tends to shrink more, but it is restrained by the thick bar, which is still hot and more ductile. As cooling continues, the stress magnitude increases until around 1800 s. After that, the temperature difference between the thick and thin bars reverses; the thick bar starts to cool faster, and the thin bar gradually changes from tensile to compressive stress, while the thick bar changes to tensile stress. This behavior is the well-known stress reversal phenomenon in stress frame castings. The residual stress at 6000 s is shown in Figure 2 (not displayed here), which indicates that the final residual stress in the thin bar is compressive and in the thick bar is tensile, with magnitudes of about 100 MPa. These results are in good agreement with analytical solutions and experimental observations reported in the literature.
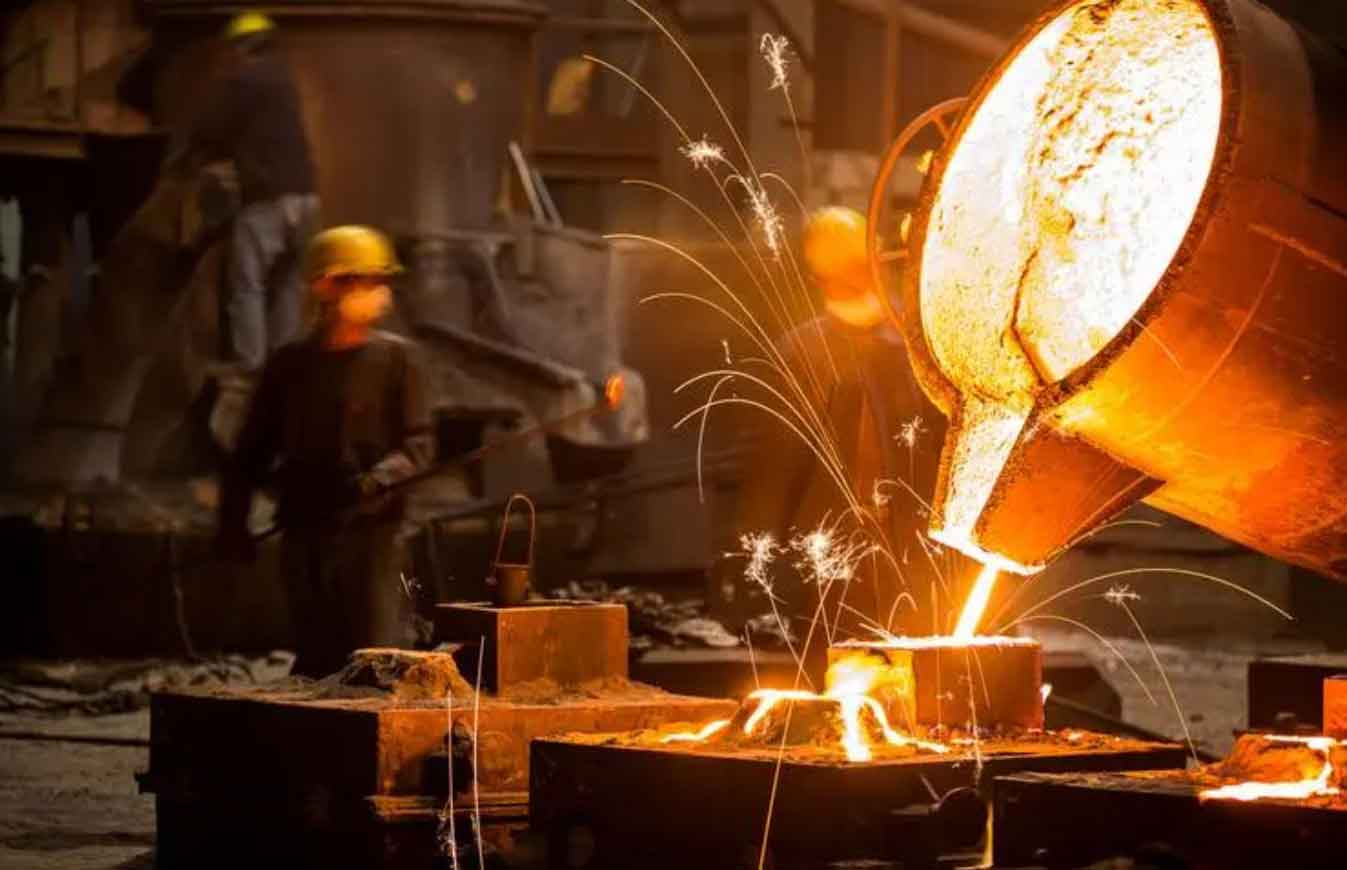
The simulation demonstrates that the proposed procedure can capture the essential features of thermal stress development in sand casting parts. The stress reversal and residual stress distribution are correctly predicted, which confirms the reliability of the material model and the numerical implementation.
5. Application to a Real Seat Casting
5.1 Description of the Component
To further verify the engineering applicability, I simulated a seat casting produced by a local foundry. The seat has a maximum outer diameter of 820 mm, a height of 190 mm, and is made of ZG30 steel. The sand mold is made of self-hardening furan resin sand with 1.5–3% resin content. The pouring temperature is 1670°C. The pouring and riser systems were ignored for simplicity. The geometric model and mesh (element size 8 mm) are shown in Figure 3 (not displayed here).
5.2 Temperature Field Results
The temperature distributions at different times are shown in Figure 4 (not displayed here). At 100 s, the highest temperature region is located inside the cylindrical boss near the large flat plate. The outer side of the four bolt holes cools faster because of the core effect. At 300 s, the temperature in the boss becomes more uniform. At 600 s, the temperature range is between 427°C and 1150°C. By 1500 s, the maximum temperature is about 580°C, and the difference between the hottest and coolest regions has decreased significantly. At 3500 s, the whole seat is nearly at room temperature, with a maximum difference of only 2°C. The simulation reveals that the solidification time of the boss is longer than that of the plate, which could lead to shrinkage porosity in that region if feeding is insufficient.
5.3 Stress Field Results
Using the same procedure, the thermal stress field was computed. The stress evolution is shown in Figure 5 (not displayed here). At 600 s, the outer regions of the four bolt holes are in tension due to faster cooling. At 1500 s, the stress distribution is complex, with some areas in tension and others in compression. Around 1850 s, the stress state at the bolt holes changes sign. After 2500 s, the outer sides of the bolt holes are under compression, while the interior of the boss is under tension. Finally, at 3500 s, the residual stress is concentrated near the four bolt holes, but the overall stress magnitude is relatively low (below 80 MPa). This is consistent with the fact that the temperature differences in the seat are not extremely large, and the cast shape is relatively simple. The simulation suggests that no hot tears or severe distortion are expected, which agrees with the actual production experience.
6. Conclusions
In this thesis, I have developed a practical numerical simulation procedure for the thermal stress field of sand casting parts using the ANSYS software. The work includes the following key contributions:
- A thermo-elasto-plastic constitutive model was established to describe the mechanical behavior of the casting alloy from the solidus temperature down to room temperature. The model accounts for temperature-dependent material properties and the von Mises yield criterion.
- The sequential thermal-stress coupling method was implemented, in which the transient temperature field is first computed and then applied as body loads to the structural model. This approach is efficient and sufficiently accurate for most quenching and solidification problems.
- Special numerical treatments, such as the correction of the weighting coefficient in the elastic-plastic transition zone and the careful handling of high-temperature material properties, were adopted to ensure convergence and accuracy.
- The simulation of a typical stress frame casting successfully reproduced the well-known stress reversal phenomenon and provided a reasonable residual stress distribution, thus validating the method.
- The application to a real seat casting demonstrated the engineering usefulness of the developed procedure. The predicted temperature and stress fields matched the actual production conditions and helped identify potential shrinkage porosity locations.
In conclusion, the numerical simulation technology for the thermal stress field of sand casting parts presented in this thesis can serve as a valuable tool for foundry engineers to optimize casting designs, reduce defects, and improve the dimensional stability of castings. Future work will incorporate the effect of the sand mold’s mechanical resistance and the microscopic phenomena that influence hot tearing.
Throughout this study, I have gained profound insights into the importance of accurate material data and boundary conditions. The use of ANSYS has proven to be effective for analyzing complex thermal and mechanical problems in sand casting. I believe that this work will encourage further research and practical applications in the field of casting process simulation.
Finally, I would like to emphasize that the simulation of sand casting parts is a multidisciplinary task requiring close collaboration between computational mechanics, materials science, and process engineering. With the continuous development of computer hardware and numerical algorithms, the virtual prototyping of sand casting parts will become even more powerful and accessible, leading to higher quality and more competitive products.