


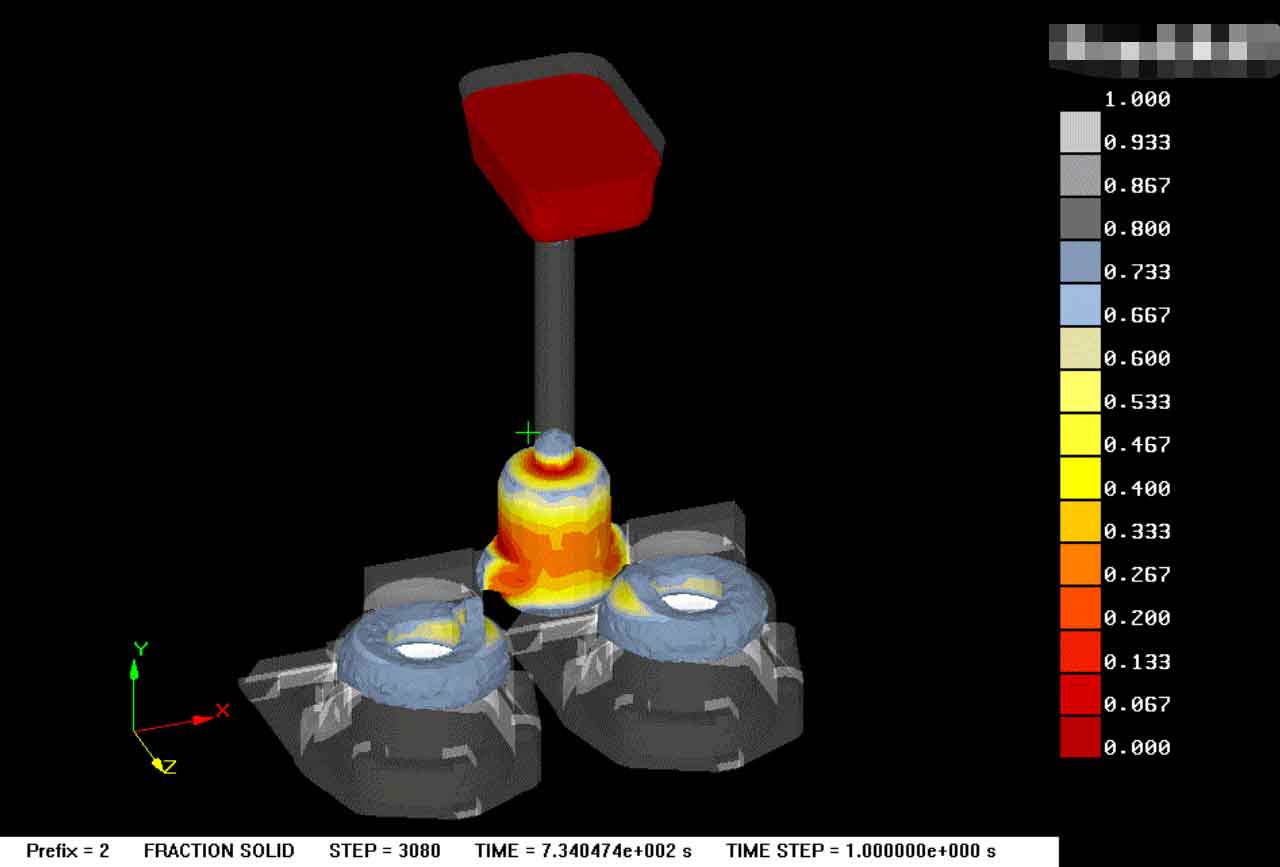


As shown in Figure 1, the change of critical solid rate in the solidification process of lost foam castings after the improved process is shown. It can be seen from a that the casting begins to solidify first from the part with thin wall thickness at the bottom. It can be seen from figure C that when t = 734s, the inner gate solidifies and the casting is disconnected from the feeding source. At this time, the solidification of lost foam casting is 57.6%. Combined with figures a to e, it can be seen that the solidification of lost foam castings basically meets the principle of sequential solidification from the bottom of the casting to the center of the riser, and the last solidified part is in the gate cup. It can be seen from figure d that at the later stage of solidification of lost foam castings, isolated liquid phase is formed at the face of large rotation, and shrinkage porosity and shrinkage cavity defects may appear at this part. It can be seen from figure e that the riser is later than the gradual solidification, and the shrinkage cavity may also appear in the center of the riser.

Fig. 2 is the distribution diagram of solidification time of lost foam casting, which reflects the solidification time used in various parts of the casting. It can be seen from the diagram that the part with the longest solidification time, that is, the last solidification part, is in the gate cup. The solidification time of the riser is greater than the gradual solidification time, and the riser has a certain feeding effect, The reaction is basically consistent with the solid phase rate distribution diagram.

Figure 3 shows the distribution of shrinkage porosity and shrinkage cavity of lost foam casting parts. According to general engineering experience, the percentage of void volume in total volume is used as the judgment basis, and 5 ‰ is used as the standard to judge shrinkage porosity and shrinkage cavity. It can be seen from the figure that the shrinkage cavity is mainly distributed in the riser and gate cup, and gradually there is no shrinkage cavity, which is basically consistent with the reflection of the solid phase rate distribution diagram and solidification time distribution diagram.